Fig. 38
Download original image
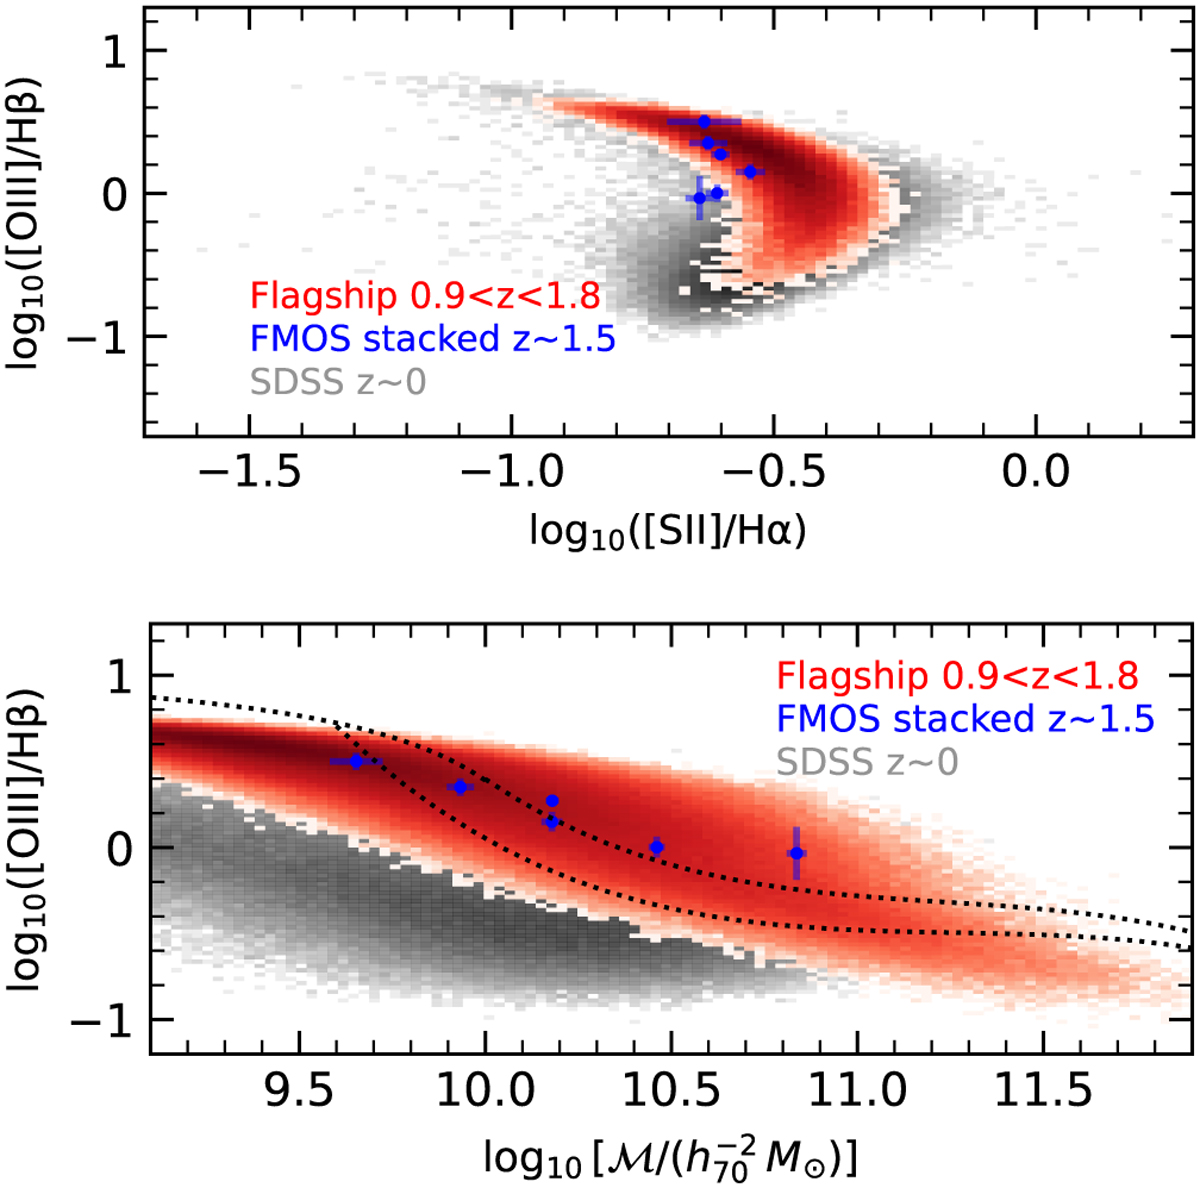
Emission lines ratios in the Flagship simulation. Flagship galaxy fluxes (red colour map) compared to SDSS fluxes (grey map) from the main target sample for objects classified as galaxies in the local Universe. In blue, we also show FMOS stacked data in COSMOS from Kashino et al. (2019). Top panel: [O III]/Hβ versus [S II]/Hα. Bottom panel: [O III]/Hβ versus stellar mass; the thin dotted curves indicate the divisions between star-forming/composite galaxies and AGN at z ≃ 0 (Juneau et al. 2014), with AGN populating the region of larger [O III]/Hβ above the dotted lines.
Current usage metrics show cumulative count of Article Views (full-text article views including HTML views, PDF and ePub downloads, according to the available data) and Abstracts Views on Vision4Press platform.
Data correspond to usage on the plateform after 2015. The current usage metrics is available 48-96 hours after online publication and is updated daily on week days.
Initial download of the metrics may take a while.