Fig. 36
Download original image
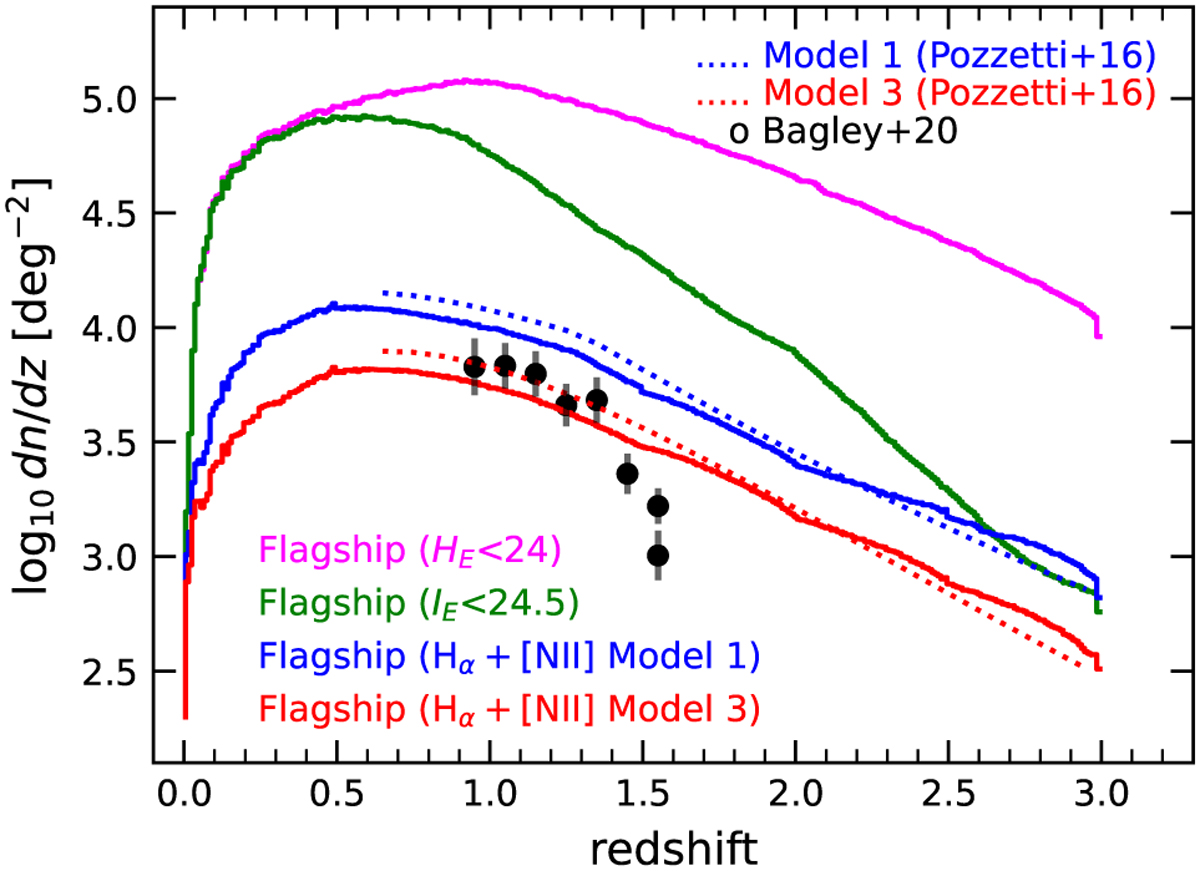
Expected number densities for photometric and spectroscopic emission line flux selected samples as a function of redshift in the Euclid Wide Survey. Different colours show various selection cuts for the EWS (in IE , HE , and in the 2 model calibrations for the line fluxes of fHα+[N II] > 2 × 10⁻¹⁶ erg s−1 cm−2). The empirical model of Pozzetti et al. (2016) and the data based on slitless HST spectroscopy (Bagley et al. 2020) are also shown.
Current usage metrics show cumulative count of Article Views (full-text article views including HTML views, PDF and ePub downloads, according to the available data) and Abstracts Views on Vision4Press platform.
Data correspond to usage on the plateform after 2015. The current usage metrics is available 48-96 hours after online publication and is updated daily on week days.
Initial download of the metrics may take a while.