Fig. 2
Download original image
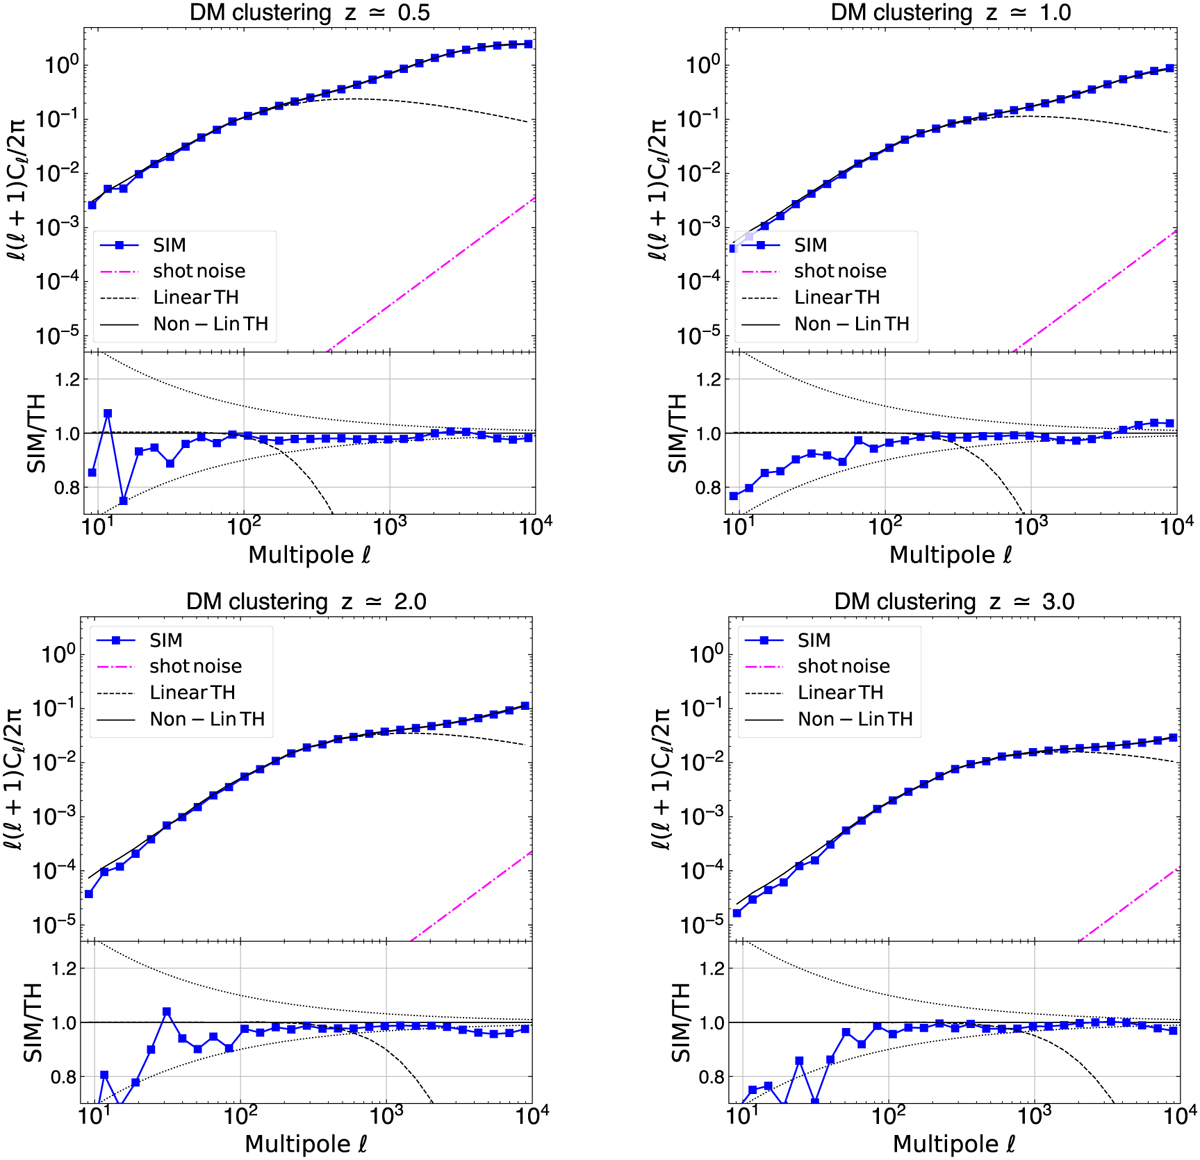
Angular power spectrum of the dark matter field in the lightcone across different redshifts. Plots show the clustering in the following z-bins: 0.49 < z < 0.51 (top left), 0.99 < z < 1.00 (top right), 2.02 < z < 2.08 (bottom left) and 2.94 < z < 3.06 (bottom right). The clustering in the simulation (symbols) is compared against linear (dashed) and nonlinear (solid) theoretical predictions (Takahashi et al. 2012). Particle shot-noise is also shown for reference (dot-dashed line). Residuals with respect to nonlinear theory are displayed in the lower panels, along with sample variance error envelopes (dotted).
Current usage metrics show cumulative count of Article Views (full-text article views including HTML views, PDF and ePub downloads, according to the available data) and Abstracts Views on Vision4Press platform.
Data correspond to usage on the plateform after 2015. The current usage metrics is available 48-96 hours after online publication and is updated daily on week days.
Initial download of the metrics may take a while.