Fig. 9
Download original image
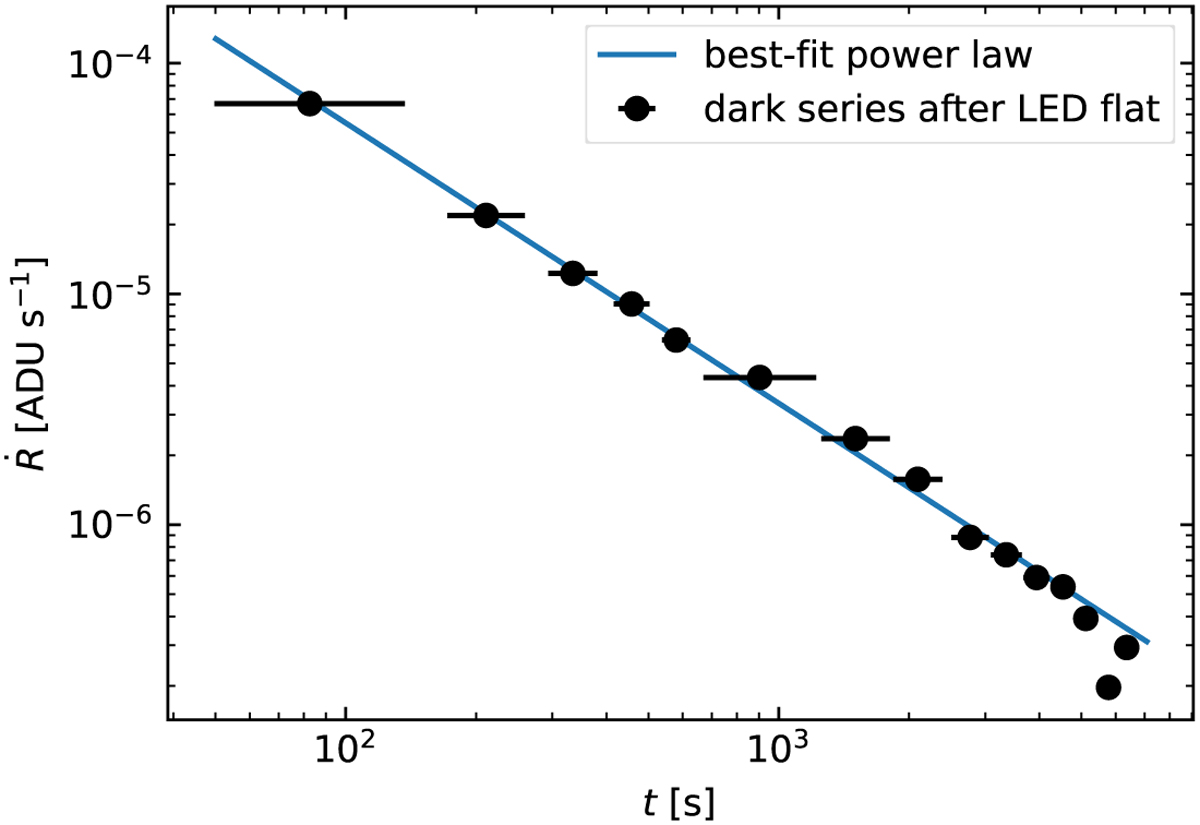
Release rate Ṙ for an example pixel derived from an LED flat with a subsequent series of dark exposures. The data points show the persistence signal P in the dark images with the bias pedestal (1024 ADU) subtracted and normalised by the exposure time and initial signal S . The horizontal error bars mark the beginning and end of each dark exposure. The best-fit power law (A = −1.215, B = −1.829) is shown in blue.
Current usage metrics show cumulative count of Article Views (full-text article views including HTML views, PDF and ePub downloads, according to the available data) and Abstracts Views on Vision4Press platform.
Data correspond to usage on the plateform after 2015. The current usage metrics is available 48-96 hours after online publication and is updated daily on week days.
Initial download of the metrics may take a while.