Fig. 8
Download original image
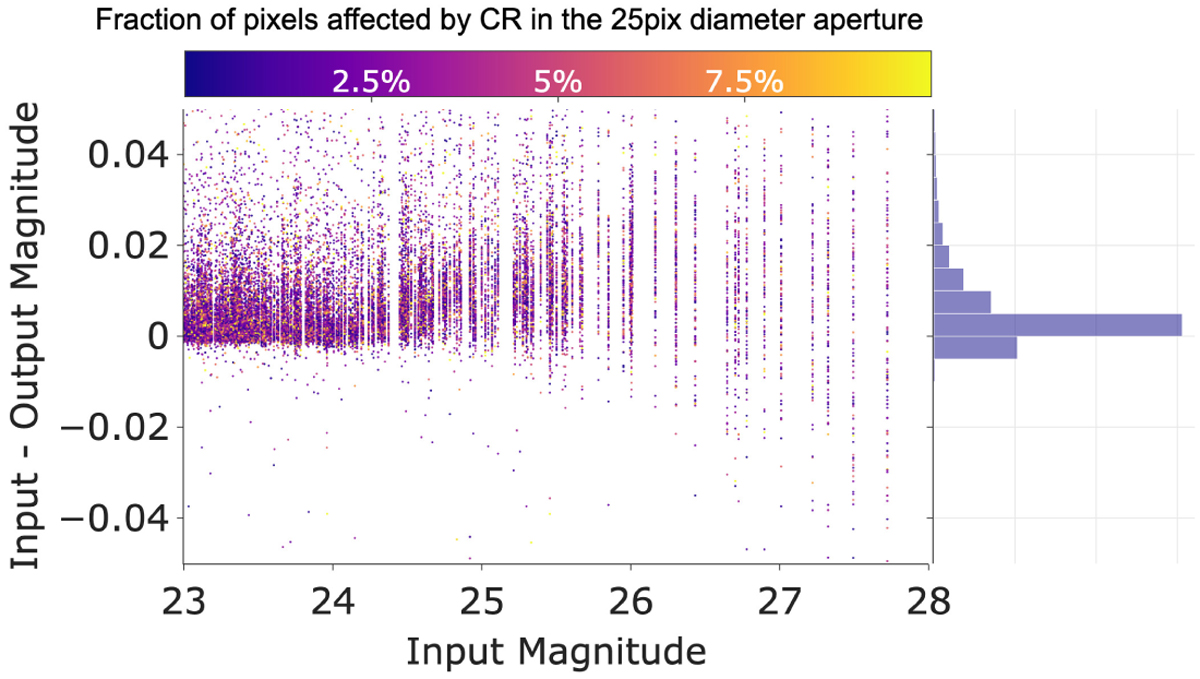
Impact of deepCR corrections on photometric accuracy. Magnitude difference between the input synthetic stars and their measured photometry after applying deepCR masking and in-painting plotted against the input magnitude (using an arbitrary zero point). The colour scale on the graph represents the number of pixels within a 25-pixel aperture diameter that were affected by CRs. On the right side of the graph, a histogram displays the distribution of the magnitude differences, providing a visual representation of the photometric accuracy and the impact of CR corrections across various levels of CR contamination.
Current usage metrics show cumulative count of Article Views (full-text article views including HTML views, PDF and ePub downloads, according to the available data) and Abstracts Views on Vision4Press platform.
Data correspond to usage on the plateform after 2015. The current usage metrics is available 48-96 hours after online publication and is updated daily on week days.
Initial download of the metrics may take a while.