Fig. 6
Download original image
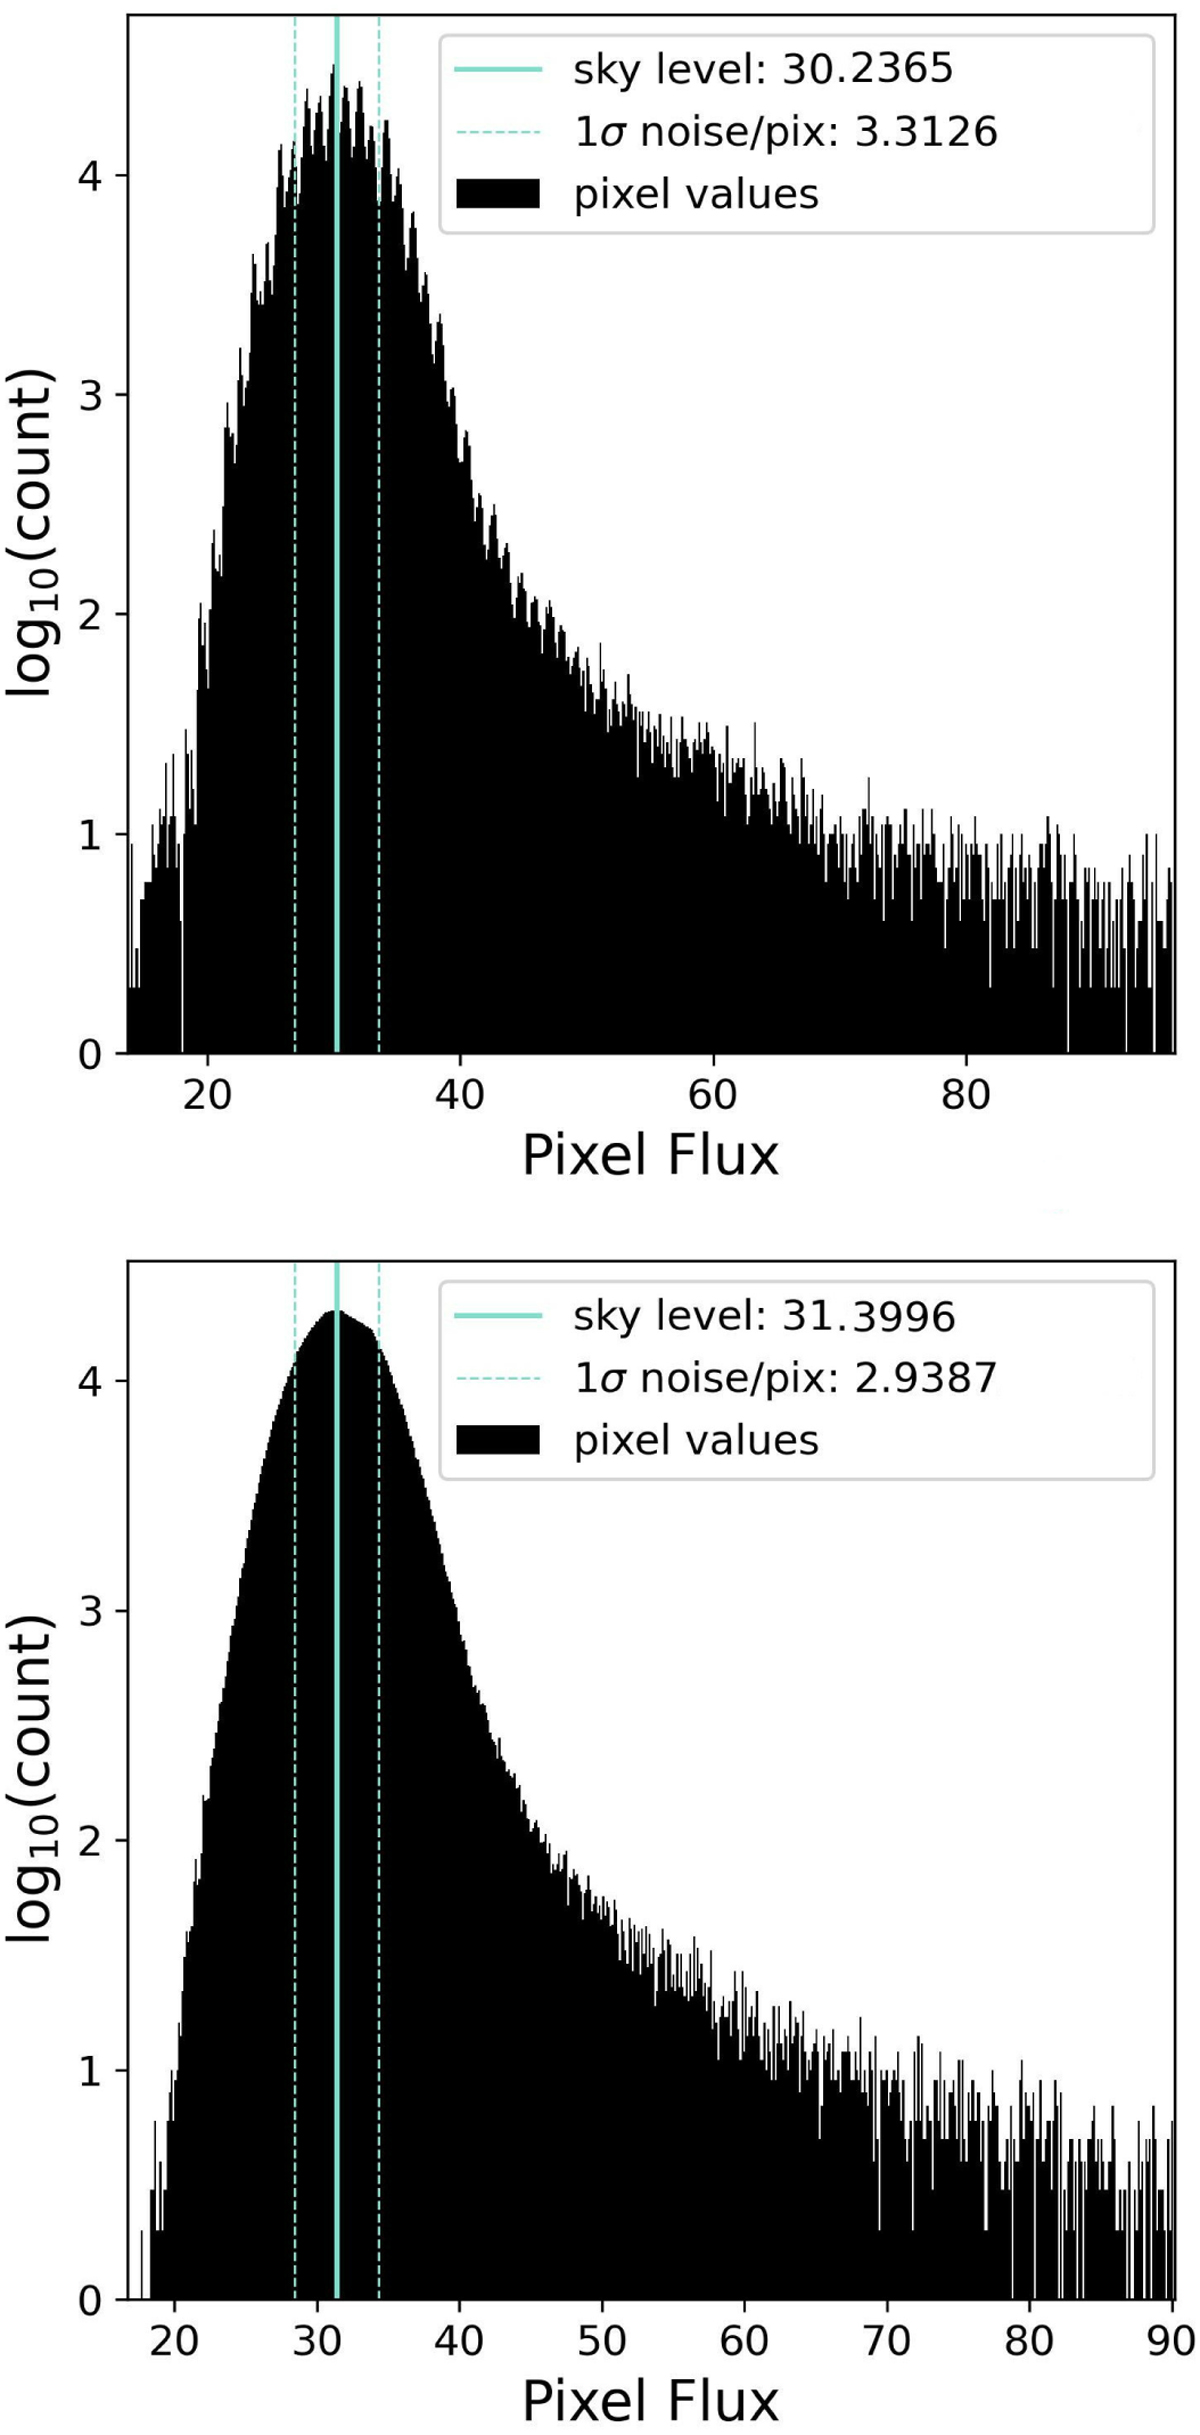
Top panel: histogram of all pixels across a 200 arcsec2 region from a VIS detrended image. The histogram shows regular spikes at the 1 ADU frequency, indicative of quantisation noise (this effect is also observed in the raw data). Bottom panel: same region after resampling the detrended image with SWarp using a Lanczos3 function. The histogram shows that the pixels have been correlated and the quantisation error has been smoothed out.
Current usage metrics show cumulative count of Article Views (full-text article views including HTML views, PDF and ePub downloads, according to the available data) and Abstracts Views on Vision4Press platform.
Data correspond to usage on the plateform after 2015. The current usage metrics is available 48-96 hours after online publication and is updated daily on week days.
Initial download of the metrics may take a while.