Fig. 3
Download original image
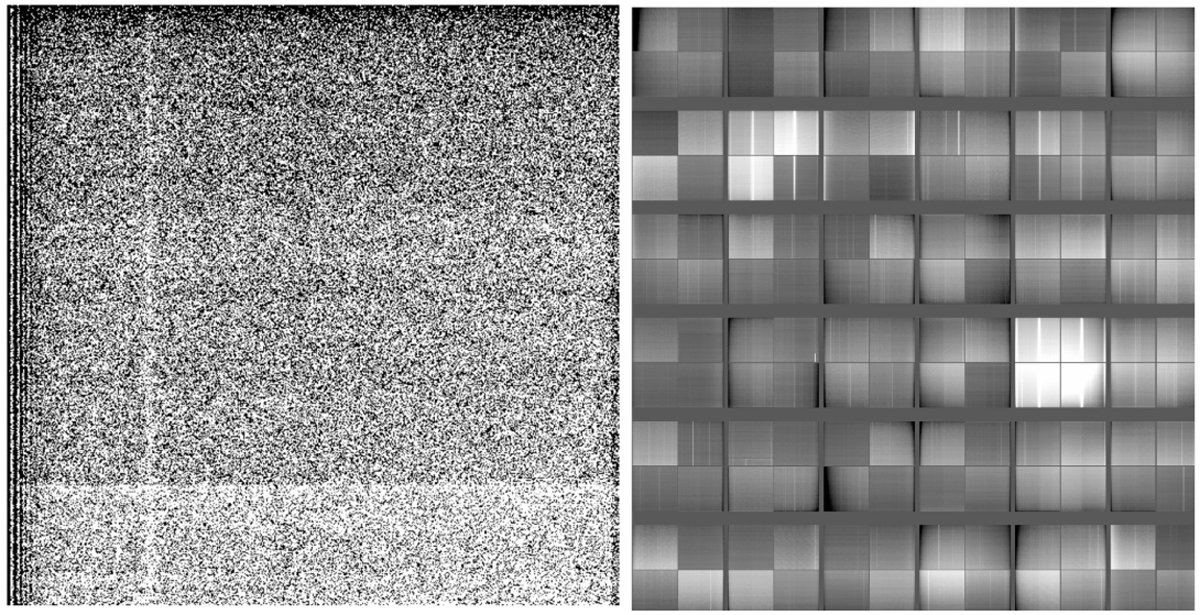
Left: features of a CCD quadrant. This quadrant from a raw bias image shows (i) a noticeable jump in the readout pedestal during readout (with more subtle variations observable throughout the readout), (ii) a top-down intensity gradient indicative of light injection during readout, and (iii) an electronic ringing effect on the left at the start of each line readout. Right: high-S/N master bias frame (median of tens of raw images) used to process all ERO data. The brightness variation here does not exceed 0.6 ADU, while the typical raw ERO signal – zodiacal light background – is around 40 ADUs, necessitating this correction.
Current usage metrics show cumulative count of Article Views (full-text article views including HTML views, PDF and ePub downloads, according to the available data) and Abstracts Views on Vision4Press platform.
Data correspond to usage on the plateform after 2015. The current usage metrics is available 48-96 hours after online publication and is updated daily on week days.
Initial download of the metrics may take a while.