Fig. 20
Download original image
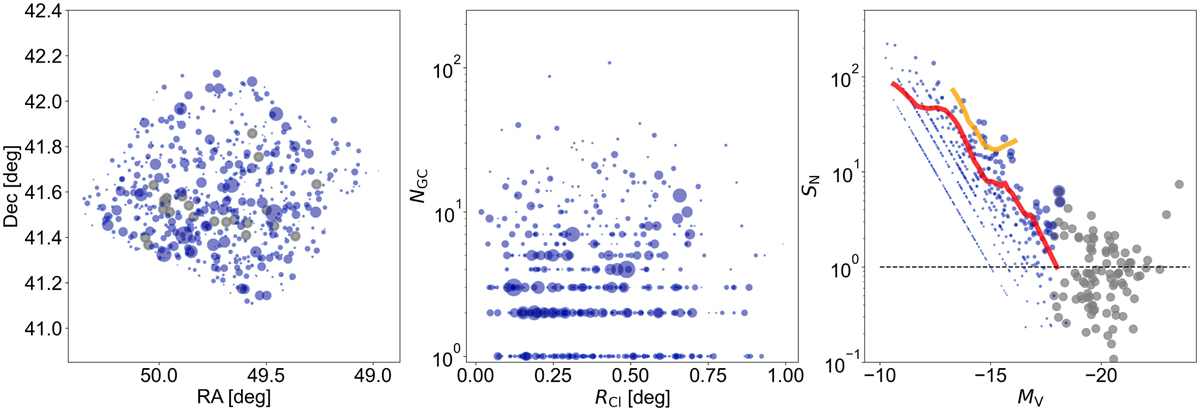
Galaxy positions and GC content. Left panel: violet circles indicate the positions of dwarf galaxies, with symbol size scaled to the specific frequency, S N. Grey circles mark the brightest galaxies in the field, with magnitudes 8 ≤ IE ≤ 13. Middle panel: total population of GC candidates in dwarf galaxies, NGC (log scale), plotted against the clustercentric distance, RCl , from the BCG. The symbol sizes correspond to those in the left panel. Right panel: specific frequency vs. magnitude plot. The colours and symbols are as in the left panel, except that the symbol size is scaled to NGC. The red curve shows the relation from Lim et al. (2020) for UDGs in Virgo, while the orange curve is for UDGs in Coma (Lim et al. 2018). The horizontal dashed line shows the S N = 1 level.
Current usage metrics show cumulative count of Article Views (full-text article views including HTML views, PDF and ePub downloads, according to the available data) and Abstracts Views on Vision4Press platform.
Data correspond to usage on the plateform after 2015. The current usage metrics is available 48-96 hours after online publication and is updated daily on week days.
Initial download of the metrics may take a while.