Fig. 18
Download original image
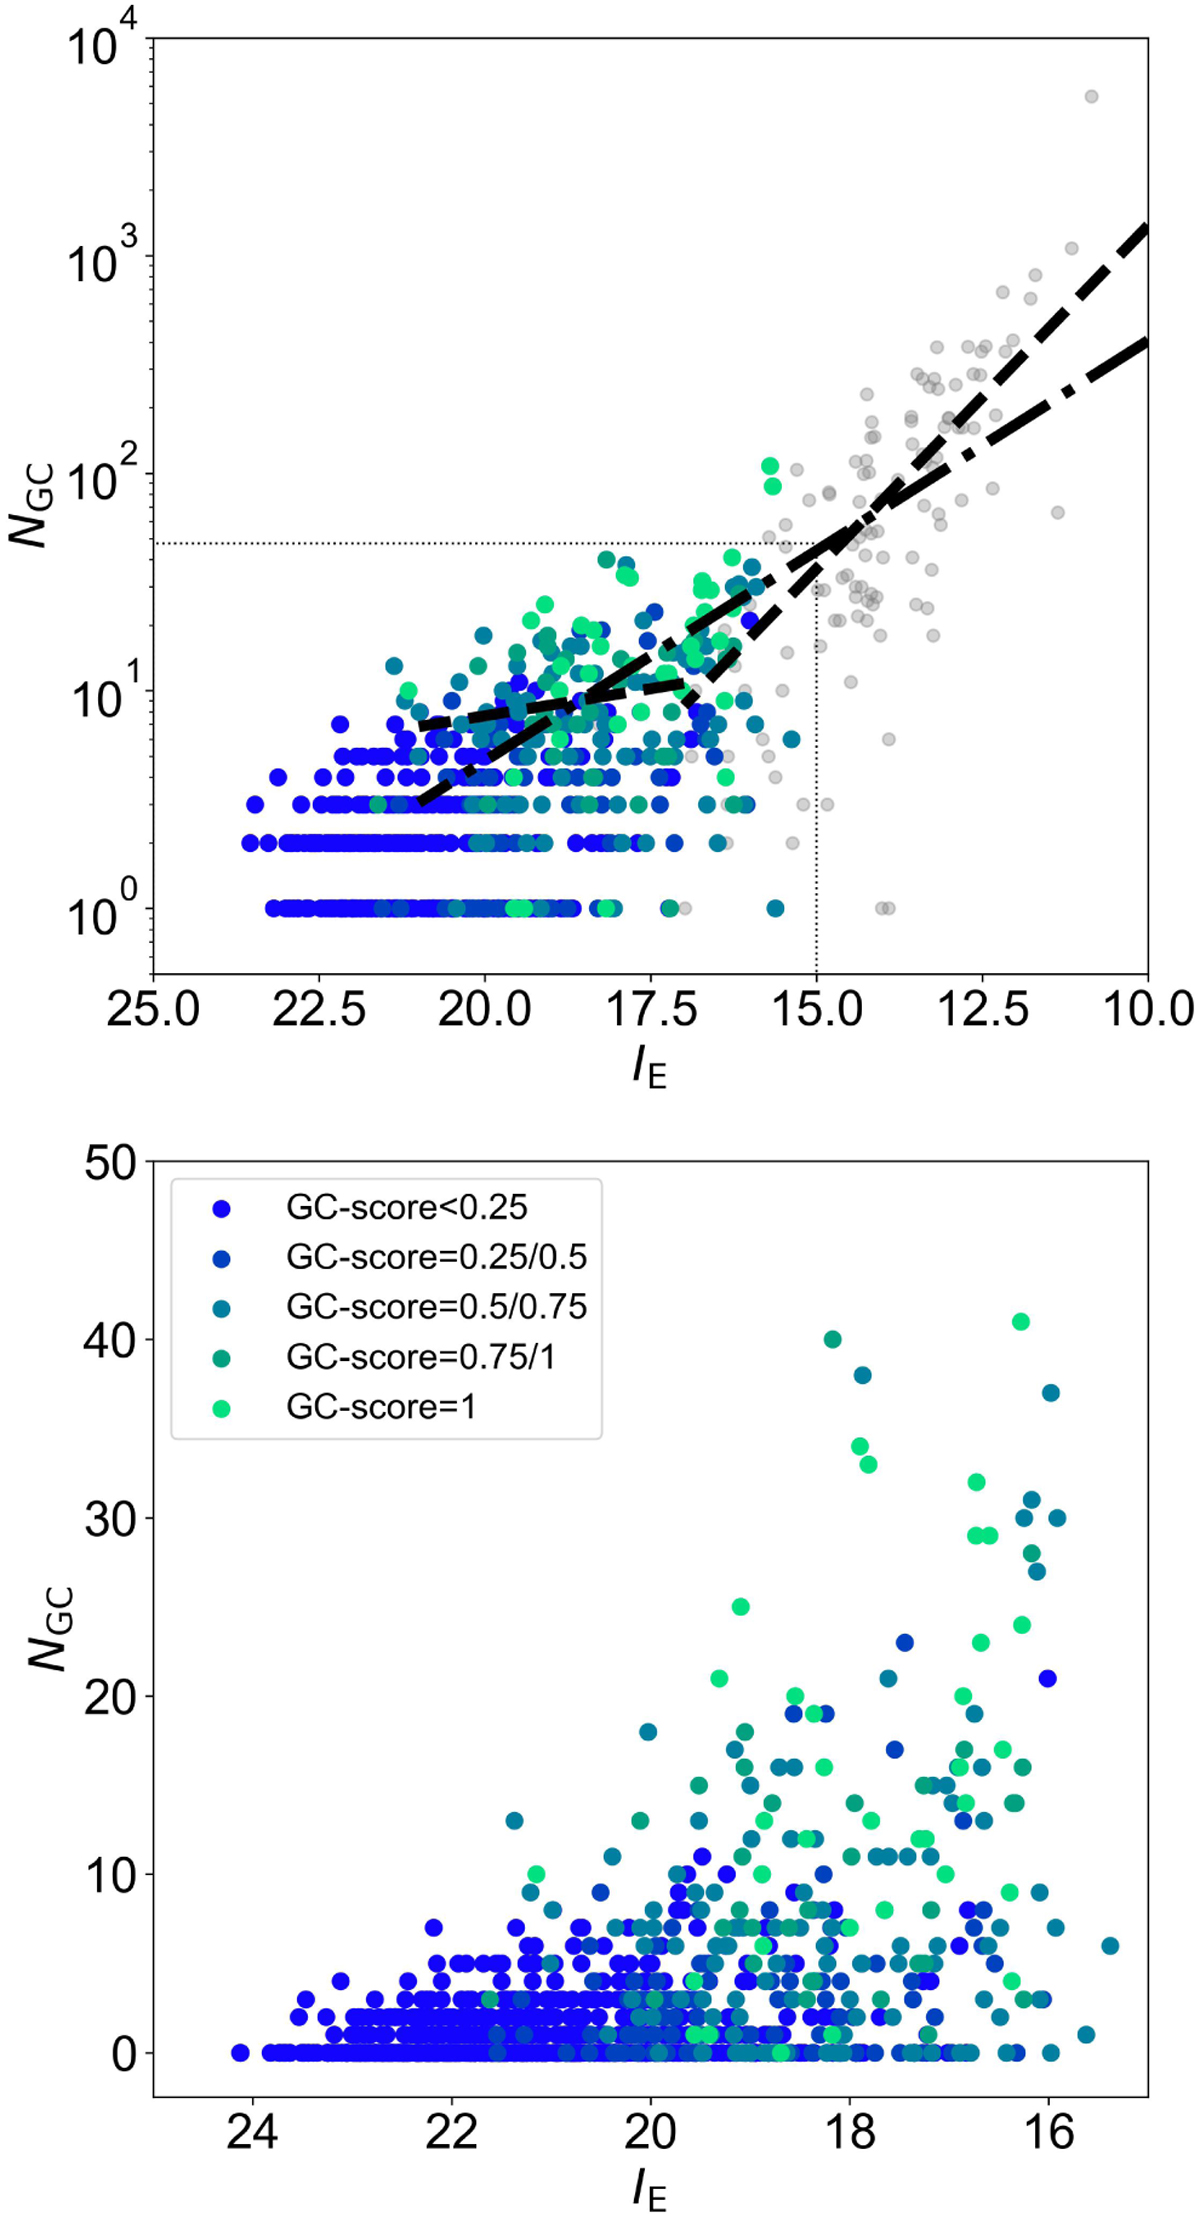
Total GC population vs galaxy IE magnitude for the full sample of galaxies (upper panel, log scale on the y-axis) and for the sample limited to faint IE < 15 galaxies (lower panel, linear y-scale). The full sample is represented by grey filled circles in the upper panel. Dwarf galaxies are symbol and colour-coded based on their GC richness score, as labelled. In the upper panel, we also report fits to the data using the sample of galaxies with 10 ≤ IE ≤ 21 and NGC ≥ 5 (dash-dotted line), as well as a broken linear fit (dashed line) obtained adopting a separation limit at IE = 17. The dotted box in the upper panel shows the position of the box in the lower panel.
Current usage metrics show cumulative count of Article Views (full-text article views including HTML views, PDF and ePub downloads, according to the available data) and Abstracts Views on Vision4Press platform.
Data correspond to usage on the plateform after 2015. The current usage metrics is available 48-96 hours after online publication and is updated daily on week days.
Initial download of the metrics may take a while.