Fig. 12
Download original image
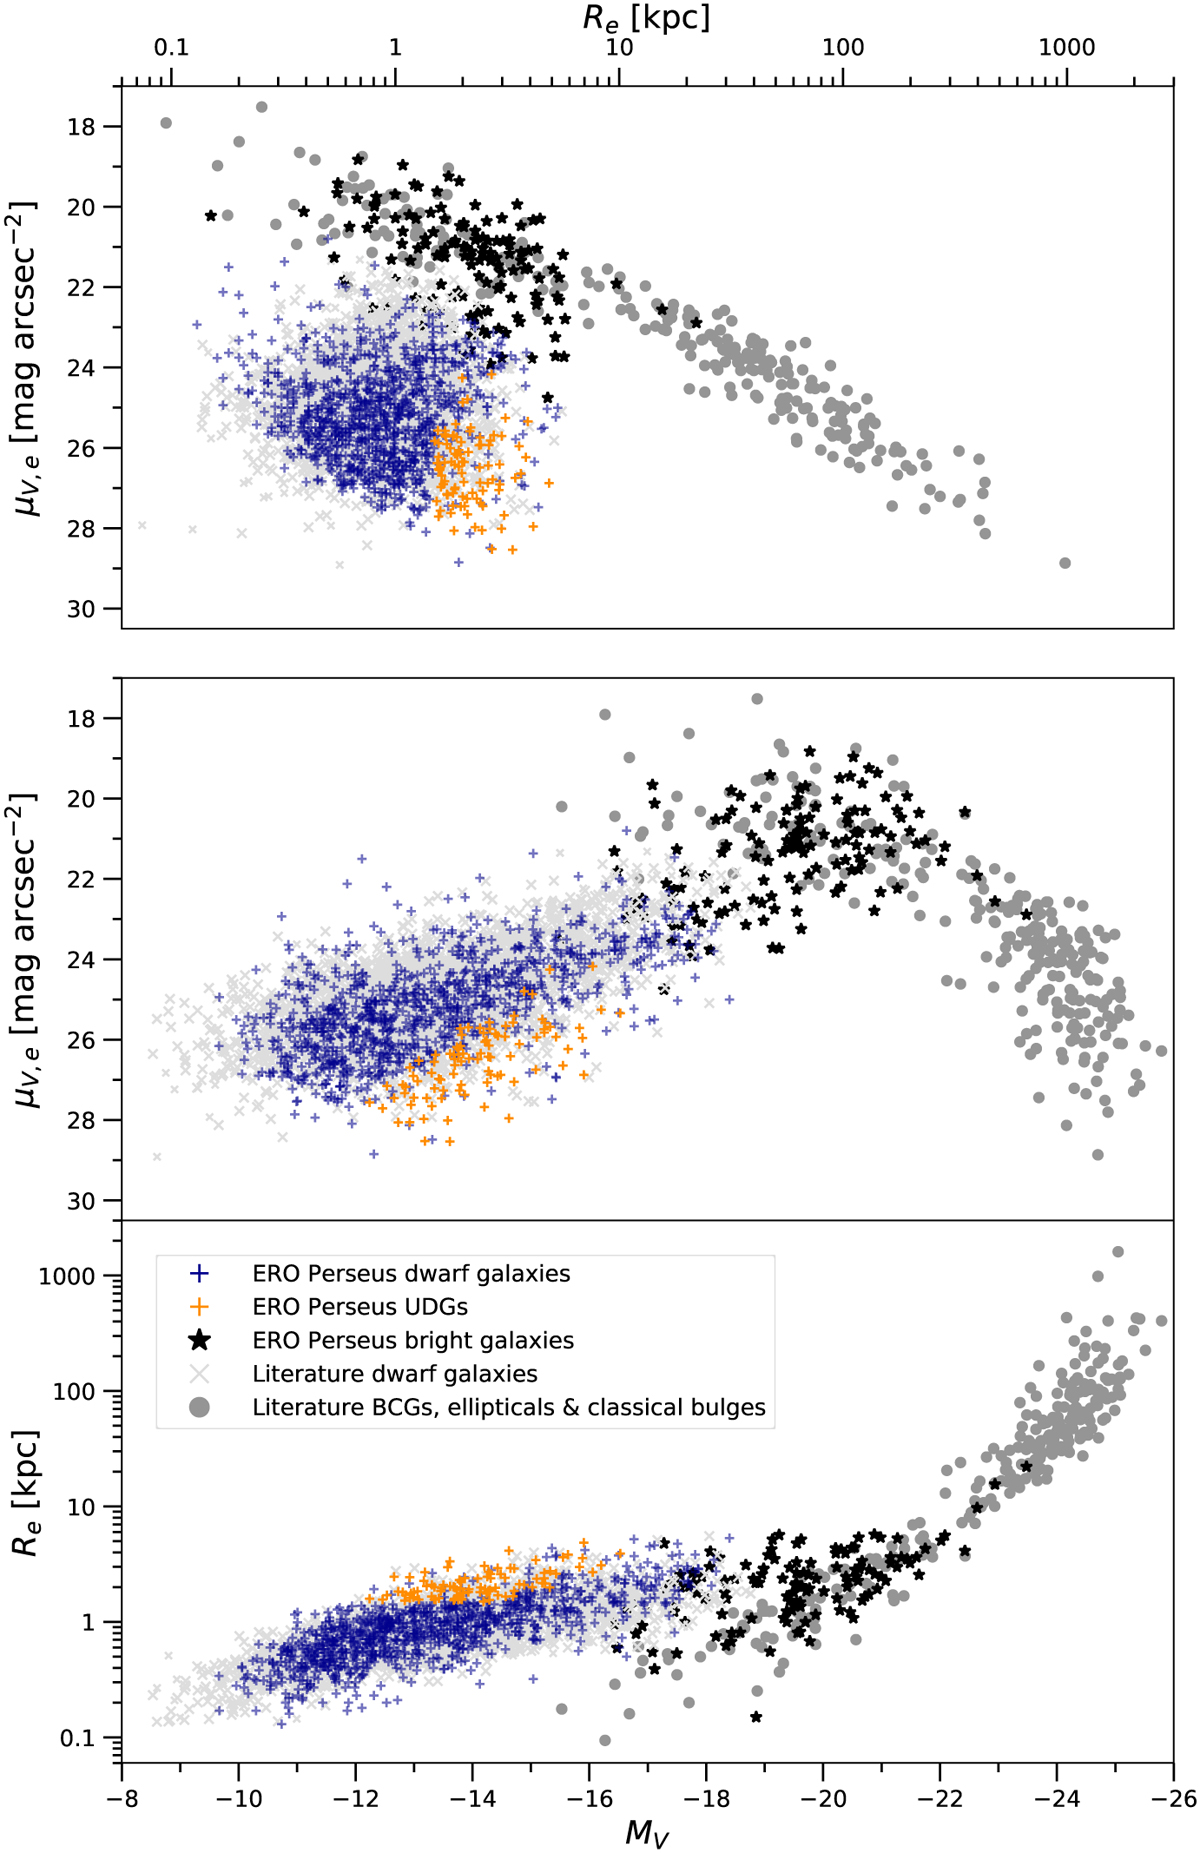
Comparison between MV, Re, and μV,e scaling relations of the ERO Perseus dwarf sample (violet), including UDGs (orange) from this work, and bright galaxies (black) from Cuillandre et al. (2025b). The basis for this plot is Figure 37 in Kormendy et al. (2009) with updates from Kormendy & Bender (2012), Bender et al. (2015), Kluge et al. (2020), Marleau et al. (2021), and Zöller et al. (2024), including brightest cluster galaxies (BCGs), ellipticals, and classical bulges (dark grey), as well as dwarf galaxies including UDGs (light grey). For the sake of clarity, we do not show the errorbars. The uncertainties vary significantly between the different galaxies.
Current usage metrics show cumulative count of Article Views (full-text article views including HTML views, PDF and ePub downloads, according to the available data) and Abstracts Views on Vision4Press platform.
Data correspond to usage on the plateform after 2015. The current usage metrics is available 48-96 hours after online publication and is updated daily on week days.
Initial download of the metrics may take a while.