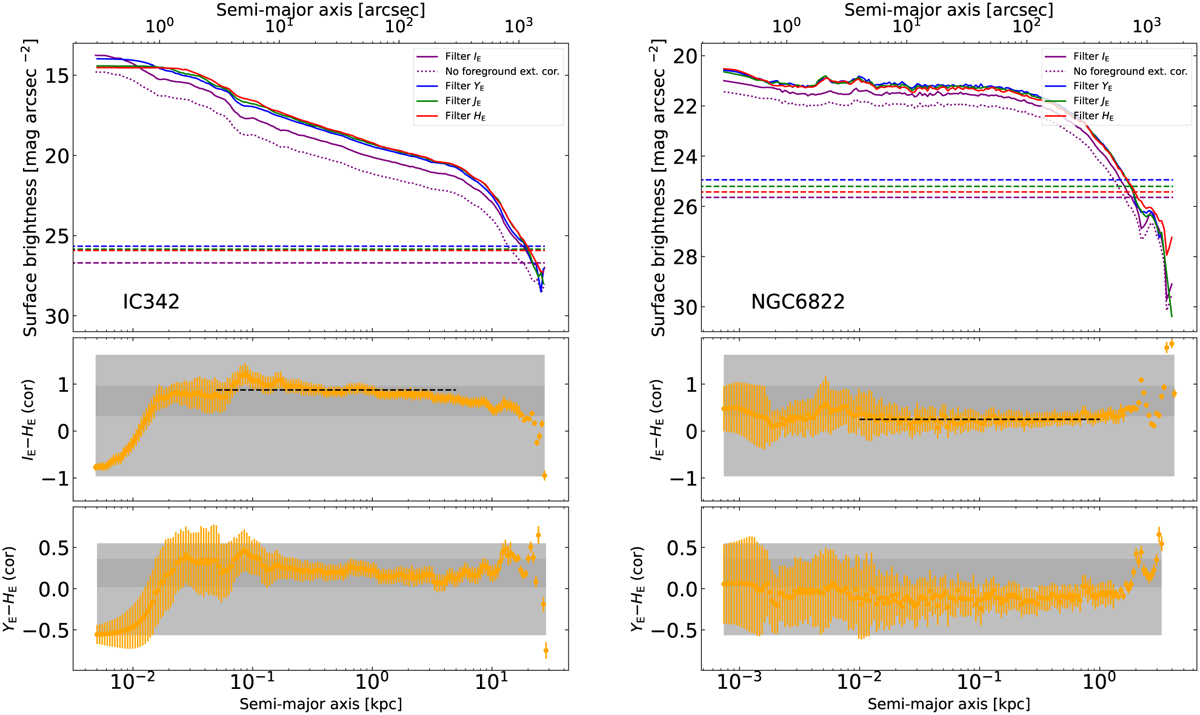
Fig. 6
Download original image
Top: Surface brightness profiles and color profiles extracted by AutoProf as described in the text for IC 342 (left panel) and NGC 6822 (right). Upper panel: SB radial profiles for IE, YE, JE, and HE . The four bands are shown as purple, blue, green, and red curves for IE, YE, JE, and HE, respectively. The 1σ SB limits from AutoProf (not rescaled to 100 arcsec2 regions) in units of mag arcsec-2 are shown as dashed horizontal lines, with colors corresponding to the Euclid bands. The fluxes have been corrected for foreground extinction (see Sect. 4.1); the uncorrected IE profile is shown as a dotted (purple) curve in the top panel. Middle and bottom: IE - HE and YE - HE radial color profiles. The top axis corresponds to galactocentric radii in units of arcsec, and the bottom in units of kpc. The mean IE - HE color over typically a factor of 100 in radius is shown as a horizontal dashed line in the middle panel; the light gray rectangular regions illustrate the full spread in model colors (see Fig. 7) and the dark gray one the standard deviation about the mean of the models. The mean galaxy IE - HE with its standard deviation is also shown as a gray rectangular region in Fig. 7.
Current usage metrics show cumulative count of Article Views (full-text article views including HTML views, PDF and ePub downloads, according to the available data) and Abstracts Views on Vision4Press platform.
Data correspond to usage on the plateform after 2015. The current usage metrics is available 48-96 hours after online publication and is updated daily on week days.
Initial download of the metrics may take a while.