Fig. 18.
Download original image
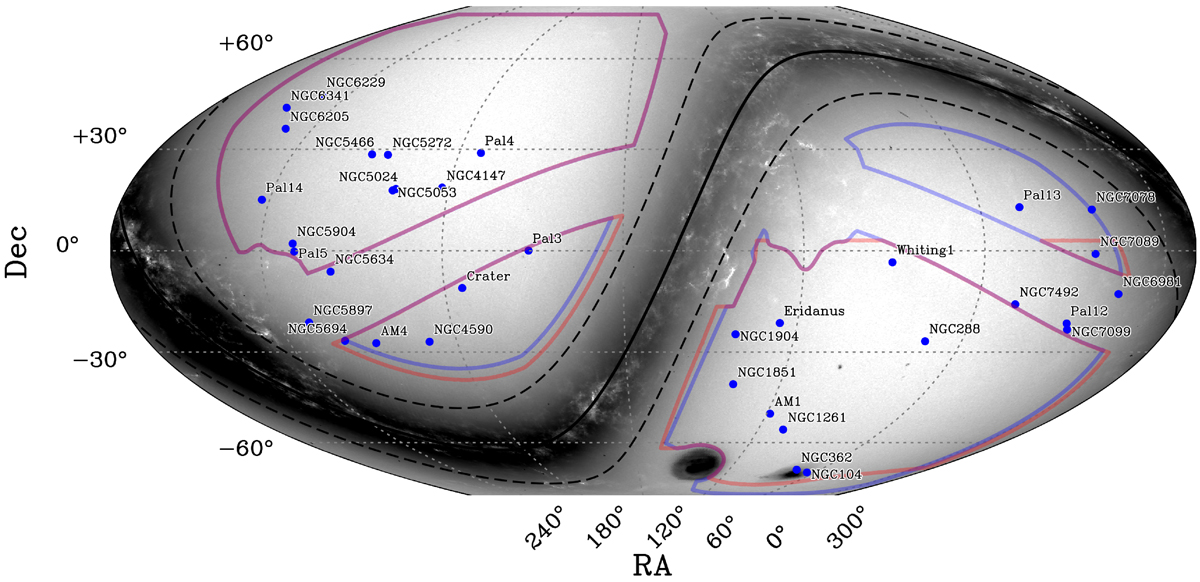
Planned region of interest (blue polygons) and footprint (red polygons) of the full 6 year Euclid wide survey shown in a McBryde-Thomas flat polar quartic projection within blue boxes. The background represents Gaia DR3 number counts in logarithmic scale. The position and names of the GCs covered by the survey or located in its proximity are highlighted in blue.
Current usage metrics show cumulative count of Article Views (full-text article views including HTML views, PDF and ePub downloads, according to the available data) and Abstracts Views on Vision4Press platform.
Data correspond to usage on the plateform after 2015. The current usage metrics is available 48-96 hours after online publication and is updated daily on week days.
Initial download of the metrics may take a while.