Fig. 17.
Download original image
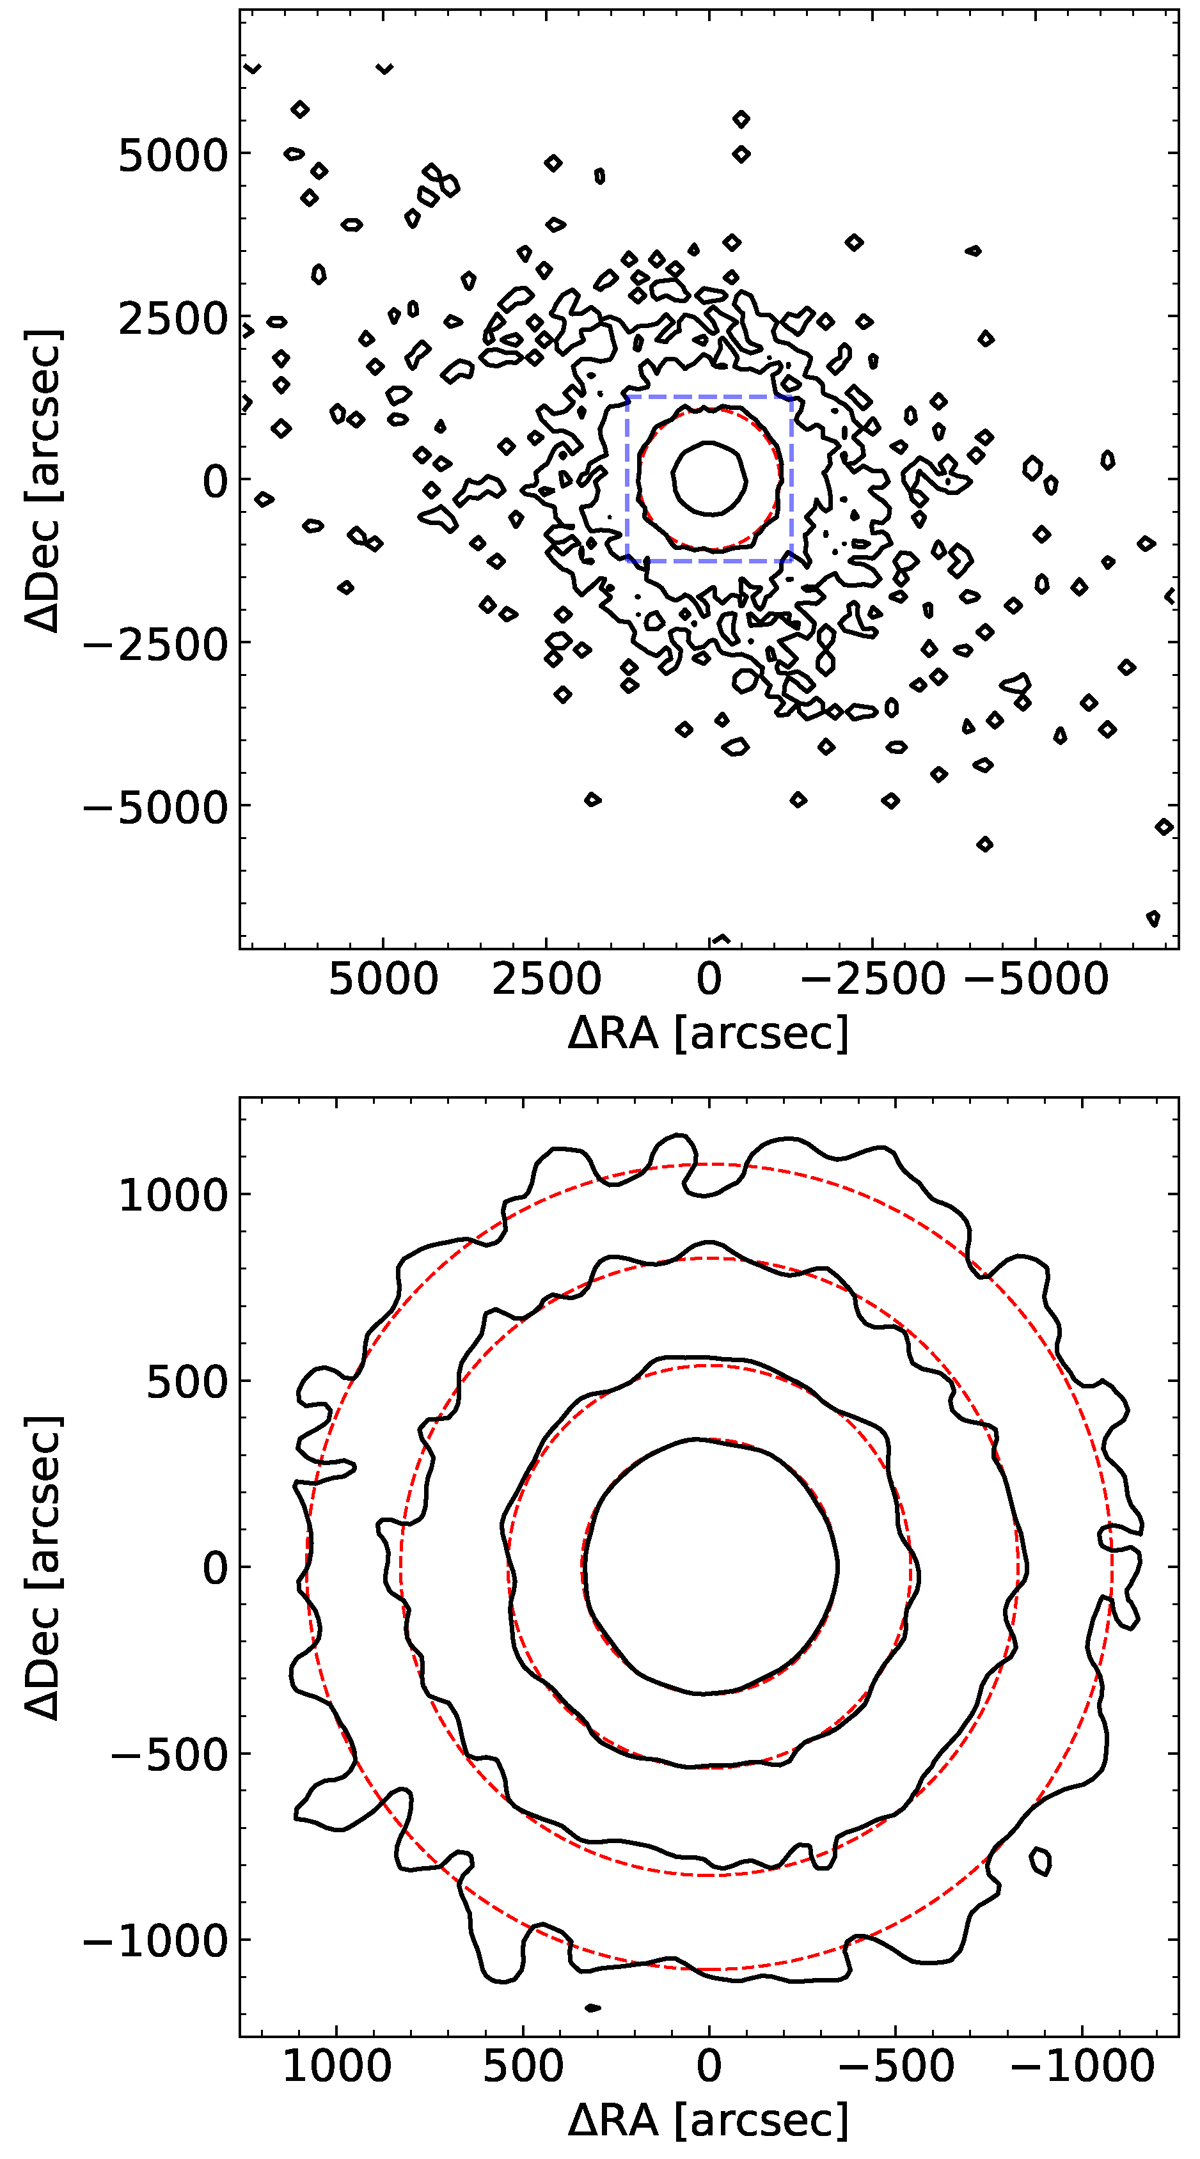
Contour maps of an N-body simulation of NGC 6397. The top panel shows NGC 6397 over a large FoV (4 × 4 deg2). The dashed blue square shows the Euclid FOV. A dashed red circle with a radius of 1080 arcsec is included to show that the simulated cluster is not significantly tidally distorted at this radius. The contours are spaced in multiples of 10. The lower panel shows the simulation over the Euclid FOV. The dashed red circles are chosen to roughly match the contours to show where the cluster is expected to be tidally stretched. The circles are at radii of 342 arcsec, 540 arcsec, 828 arcsec, and 1080 arcsec. The contours are separated by half a dex. Note that the largest circle in the bottom panel matches the circle in the top panel.
Current usage metrics show cumulative count of Article Views (full-text article views including HTML views, PDF and ePub downloads, according to the available data) and Abstracts Views on Vision4Press platform.
Data correspond to usage on the plateform after 2015. The current usage metrics is available 48-96 hours after online publication and is updated daily on week days.
Initial download of the metrics may take a while.