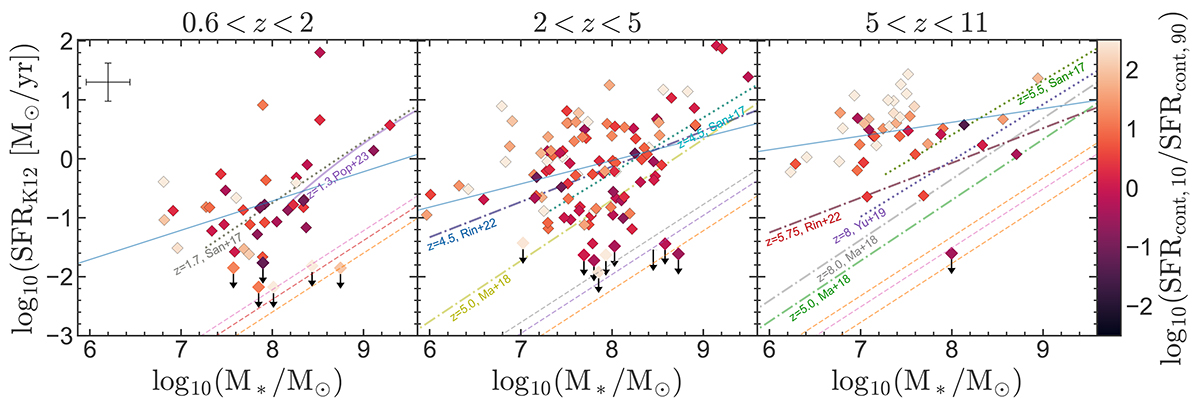
Fig. 9.
Download original image
Observational evidence for bursty SFHs: SFR mass plane color-coded by the ratio of the SFR over the last 10 Myr (SFRcont, 10), and 10–100 Myr (SFRcont, 90) before the epoch of observation. Both tracers are inferred from nonparametric SSP fitting of the stellar continuum with PPXF. Each data point represents a single galaxy. The galaxies for which no SFR could be measured are plotted with upper limits. Some are below the quenching threshold and clearly quiescent, while some residual star formation cannot be ruled out for others. More details are given in Fig. 2. In agreement with the theoretical predictions from Ma et al. (2018), Yung et al. (2019), a large fraction of our sample is star bursting, particularly at high redshift and at low mass. In contrast, many galaxies with SFRcont, 10/SFRcont, 90 ≈ 1 lie on the MS predicted by these simulations.
Current usage metrics show cumulative count of Article Views (full-text article views including HTML views, PDF and ePub downloads, according to the available data) and Abstracts Views on Vision4Press platform.
Data correspond to usage on the plateform after 2015. The current usage metrics is available 48-96 hours after online publication and is updated daily on week days.
Initial download of the metrics may take a while.