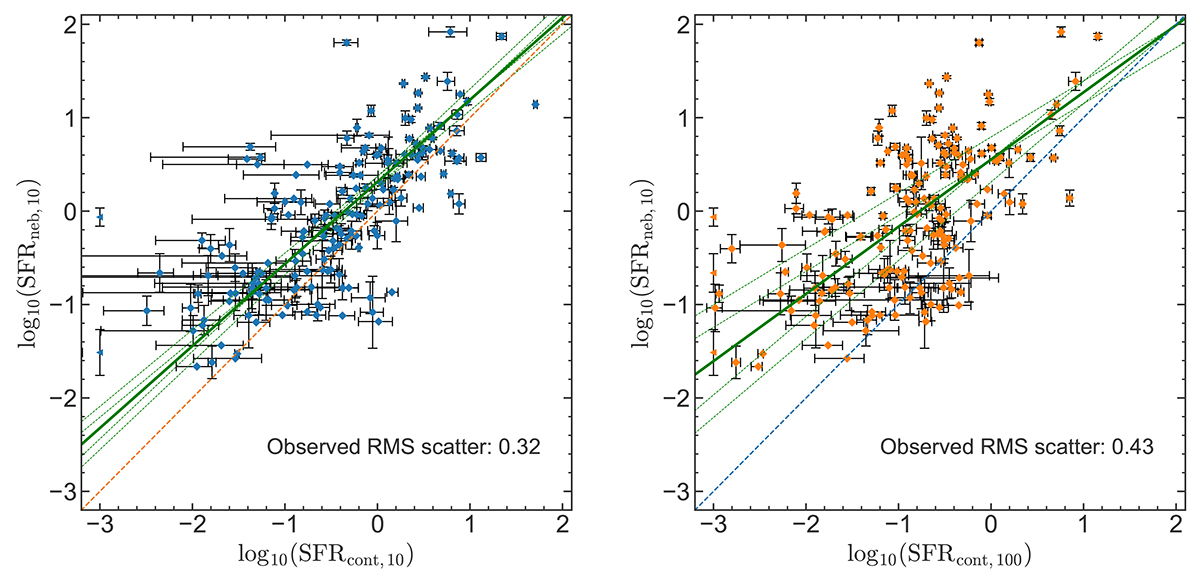
Fig. 7.
Download original image
SFR measured from nebular emission lines that trace the SFR over timescales of ∼10 Myr using the K12 relation (y-axis; see Section 2.3 for more details) vs. SFR measured from the nonparametric stellar population fit of the continuum with PPXF (x-axis). Left: SFR estimated from stellar population fitting with PPXF averaged over the last 10 Myr before the observations. The RMS scatter between the two measurements is 0.3 dex, and we note an offset of 0.2 dex (see text). Right: SFR estimated from stellar population fitting with PPXF averaged over 100 Myr before the observations.
Current usage metrics show cumulative count of Article Views (full-text article views including HTML views, PDF and ePub downloads, according to the available data) and Abstracts Views on Vision4Press platform.
Data correspond to usage on the plateform after 2015. The current usage metrics is available 48-96 hours after online publication and is updated daily on week days.
Initial download of the metrics may take a while.