Fig. 2.
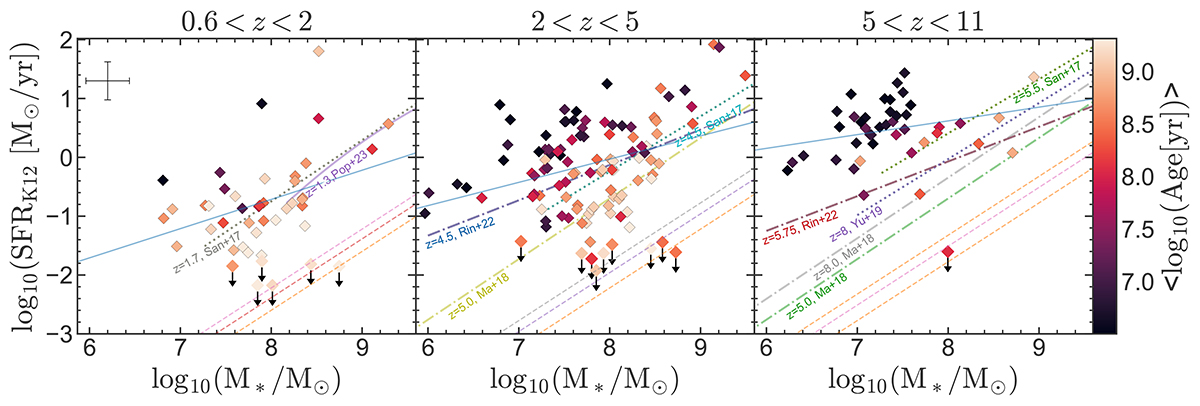
Download original image
SFR-mass plane, color-coded by the average mass-weighted stellar ages measured by PPXF in three different redshift bins. Each data point represents a single galaxy. The blue lines represent a simple linear fit to the SFR–M⋆ relation of this sample in that redshift bin. For reference, various observational MS estimates (Santini et al. 2017; Popesso et al. 2023; Rinaldi et al. 2022) and predictions from simulations (Ma et al. 2018; Yung et al. 2019) are presented, as indicated by the labels. We extrapolated these MS by ca. 0.5 dex in stellar mass where necessary to compare them to our lower-mass sample. The three dotted lines indicate the quenched threshold for the same redshifts (see main text). The error bar in the upper left corner represents the RMS errors for M⋆ and SFR for the entire sample. Quiescent and (mini-)quenched galaxies and other galaxies for which no SFR could be estimated because the relevant nebular emission lines were not detected are plotted with upper limits.
Current usage metrics show cumulative count of Article Views (full-text article views including HTML views, PDF and ePub downloads, according to the available data) and Abstracts Views on Vision4Press platform.
Data correspond to usage on the plateform after 2015. The current usage metrics is available 48-96 hours after online publication and is updated daily on week days.
Initial download of the metrics may take a while.