Fig. 1.
Download original image
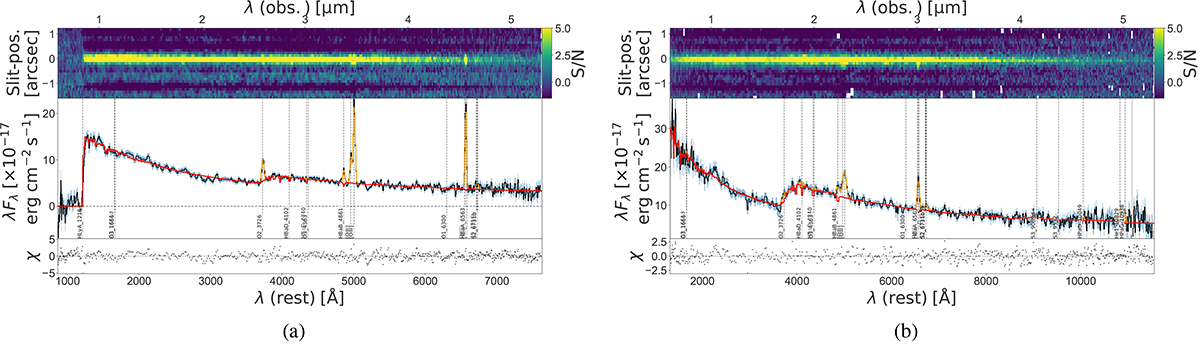
Examples of JADES/HST-DEEP spectra at high redshift. The fitted PPXF continuum is shown in red, and the nebular emission lines are shown in yellow. The bottom panel indicates the reduced residuals of the fits The vertical dashed lines mark the rest-frame wavelengths of strong nebular emission lines. The noise is indicated by the shaded blue regions. The upper panel shows the S/N of the combined 2D spectrum (the 1D spectrum was not extracted from the combined 2D spectrum). Left: A star-bursting galaxy at redshift z = 5.9 that might be rejuvenating. We note the simultaneous presence of (i) a Balmer break and a shallow β-slope, and (ii) strong nebular emission lines. Right: A weakly star-forming galaxy at redshift z = 3.6. We note the simultaneous presence of (i) a strong Balmer break and a shallow β-slope, and (ii) weak nebular emission lines.
Current usage metrics show cumulative count of Article Views (full-text article views including HTML views, PDF and ePub downloads, according to the available data) and Abstracts Views on Vision4Press platform.
Data correspond to usage on the plateform after 2015. The current usage metrics is available 48-96 hours after online publication and is updated daily on week days.
Initial download of the metrics may take a while.