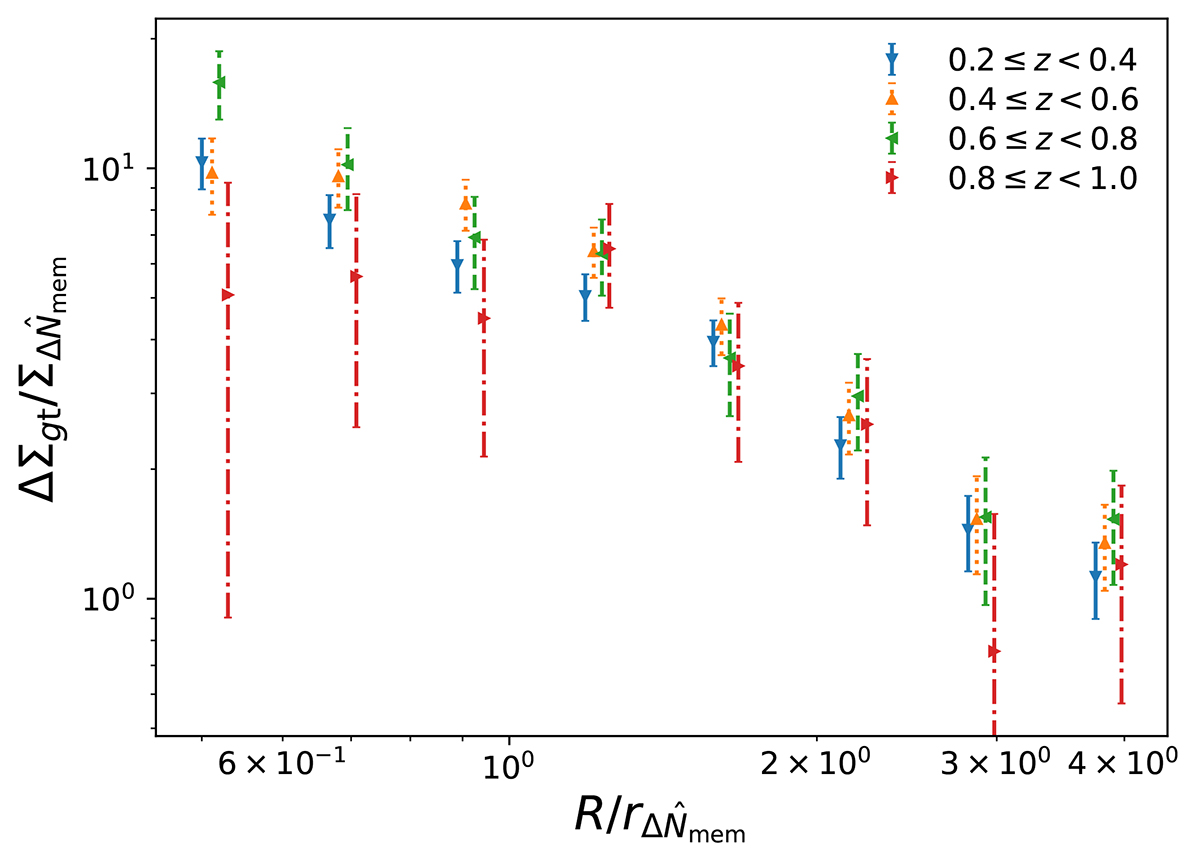
Fig. 4.
Download original image
Average reduced excess surface density profiles of massive CAMIRA clusters as a function of distance from the lens centre. The lengths and densities are rescaled by over-density units. The vertical error bars represent the square root of the diagonal elements of the total uncertainty covariance matrix, including statistical and LSS noise. The profiles are coded by colour and style according to the cluster redshifts, as in the legend, and they are horizontally shifted by 2% along the abscissa for clarity.
Current usage metrics show cumulative count of Article Views (full-text article views including HTML views, PDF and ePub downloads, according to the available data) and Abstracts Views on Vision4Press platform.
Data correspond to usage on the plateform after 2015. The current usage metrics is available 48-96 hours after online publication and is updated daily on week days.
Initial download of the metrics may take a while.