Open Access
Fig. 2.
Download original image
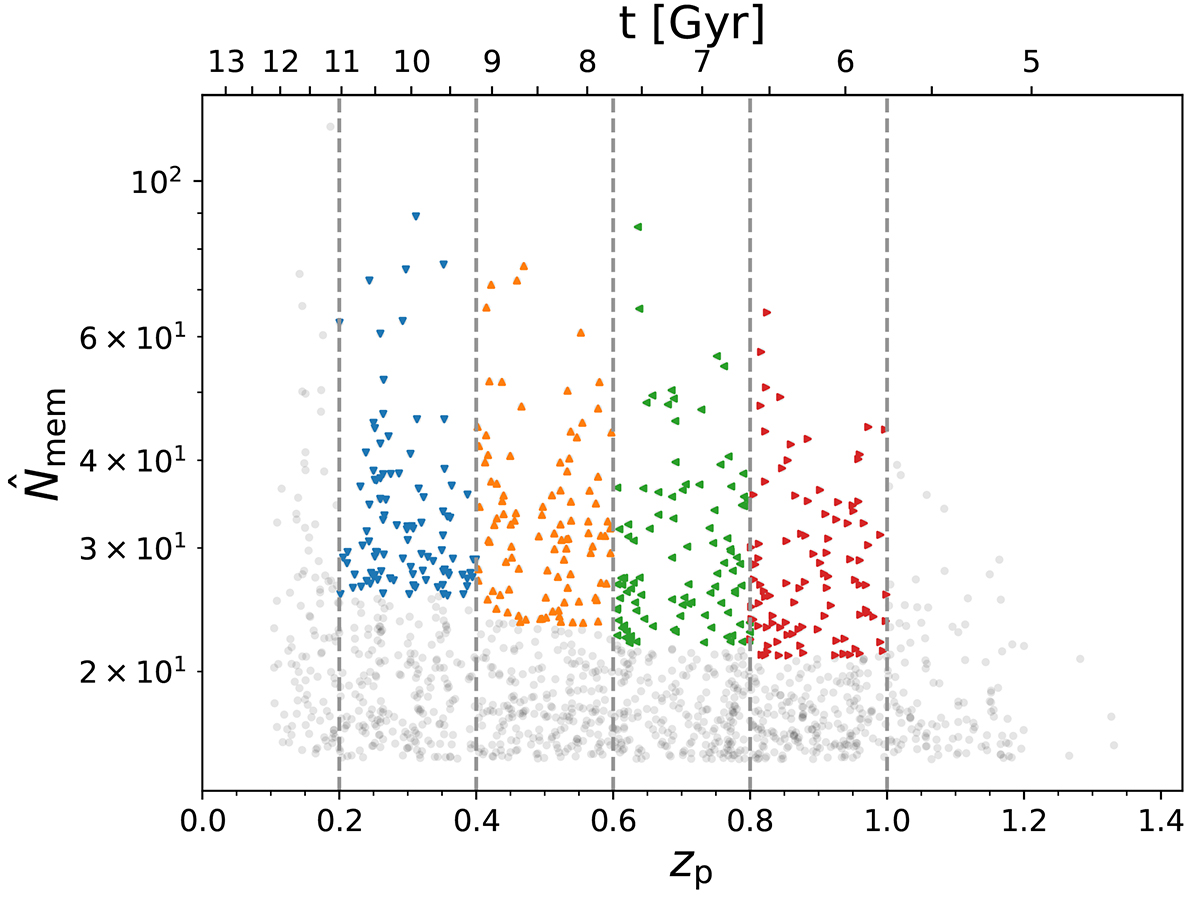
Distribution of the CAMIRA clusters in the redshift – richness plane. The age of the Universe at a given redshift is plotted on the top axis. The points are colour-coded according to their redshift bin. Clusters represented by grey points are excluded from the WL analysis.
Current usage metrics show cumulative count of Article Views (full-text article views including HTML views, PDF and ePub downloads, according to the available data) and Abstracts Views on Vision4Press platform.
Data correspond to usage on the plateform after 2015. The current usage metrics is available 48-96 hours after online publication and is updated daily on week days.
Initial download of the metrics may take a while.