Fig. E.1
Download original image
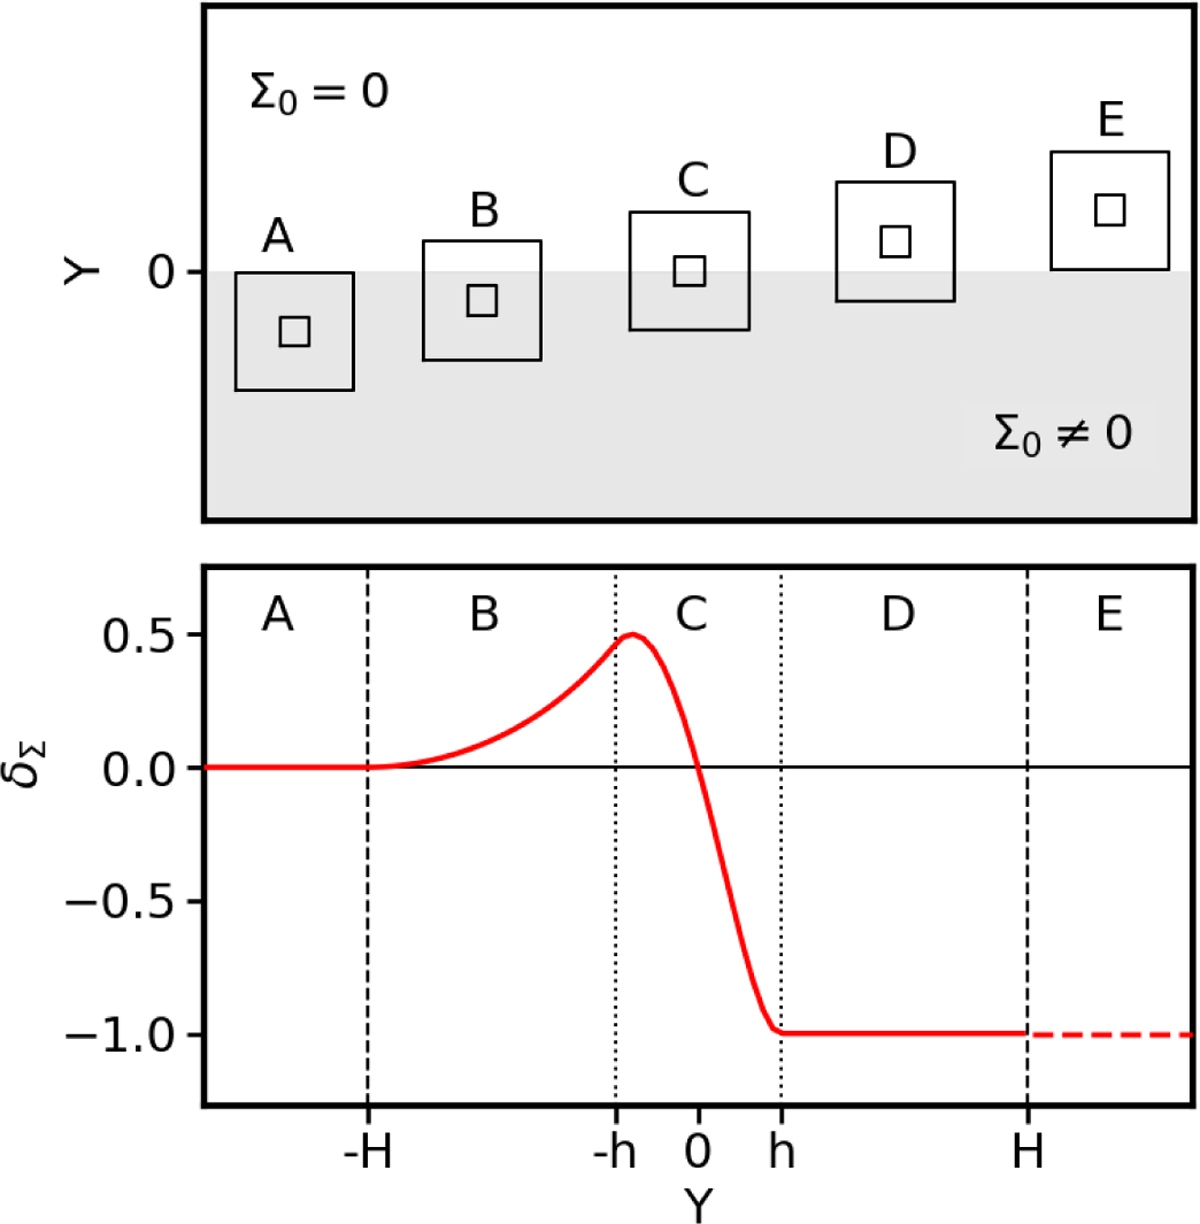
Visualisation of the border effect produced by the KDE technique on the δΣ map of the NEXUS simulations. Upper panel: scheme of the different configurations of the local (small squares) and global (large squares) scanning windows with respect to the boundary between a medium of uniform density Σ0 (grey area at negative Y) and the vacuum (white region at positive Y). Lower panel: values of δΣ for the mentioned configurations (red curve), assuming h = 0.5 kpc (vertical dotted lines) and H = 2.0 kpc (vertical dashed lines) bandwidths for the local and global kernels, respectively.
Current usage metrics show cumulative count of Article Views (full-text article views including HTML views, PDF and ePub downloads, according to the available data) and Abstracts Views on Vision4Press platform.
Data correspond to usage on the plateform after 2015. The current usage metrics is available 48-96 hours after online publication and is updated daily on week days.
Initial download of the metrics may take a while.