Fig. 1
Download original image
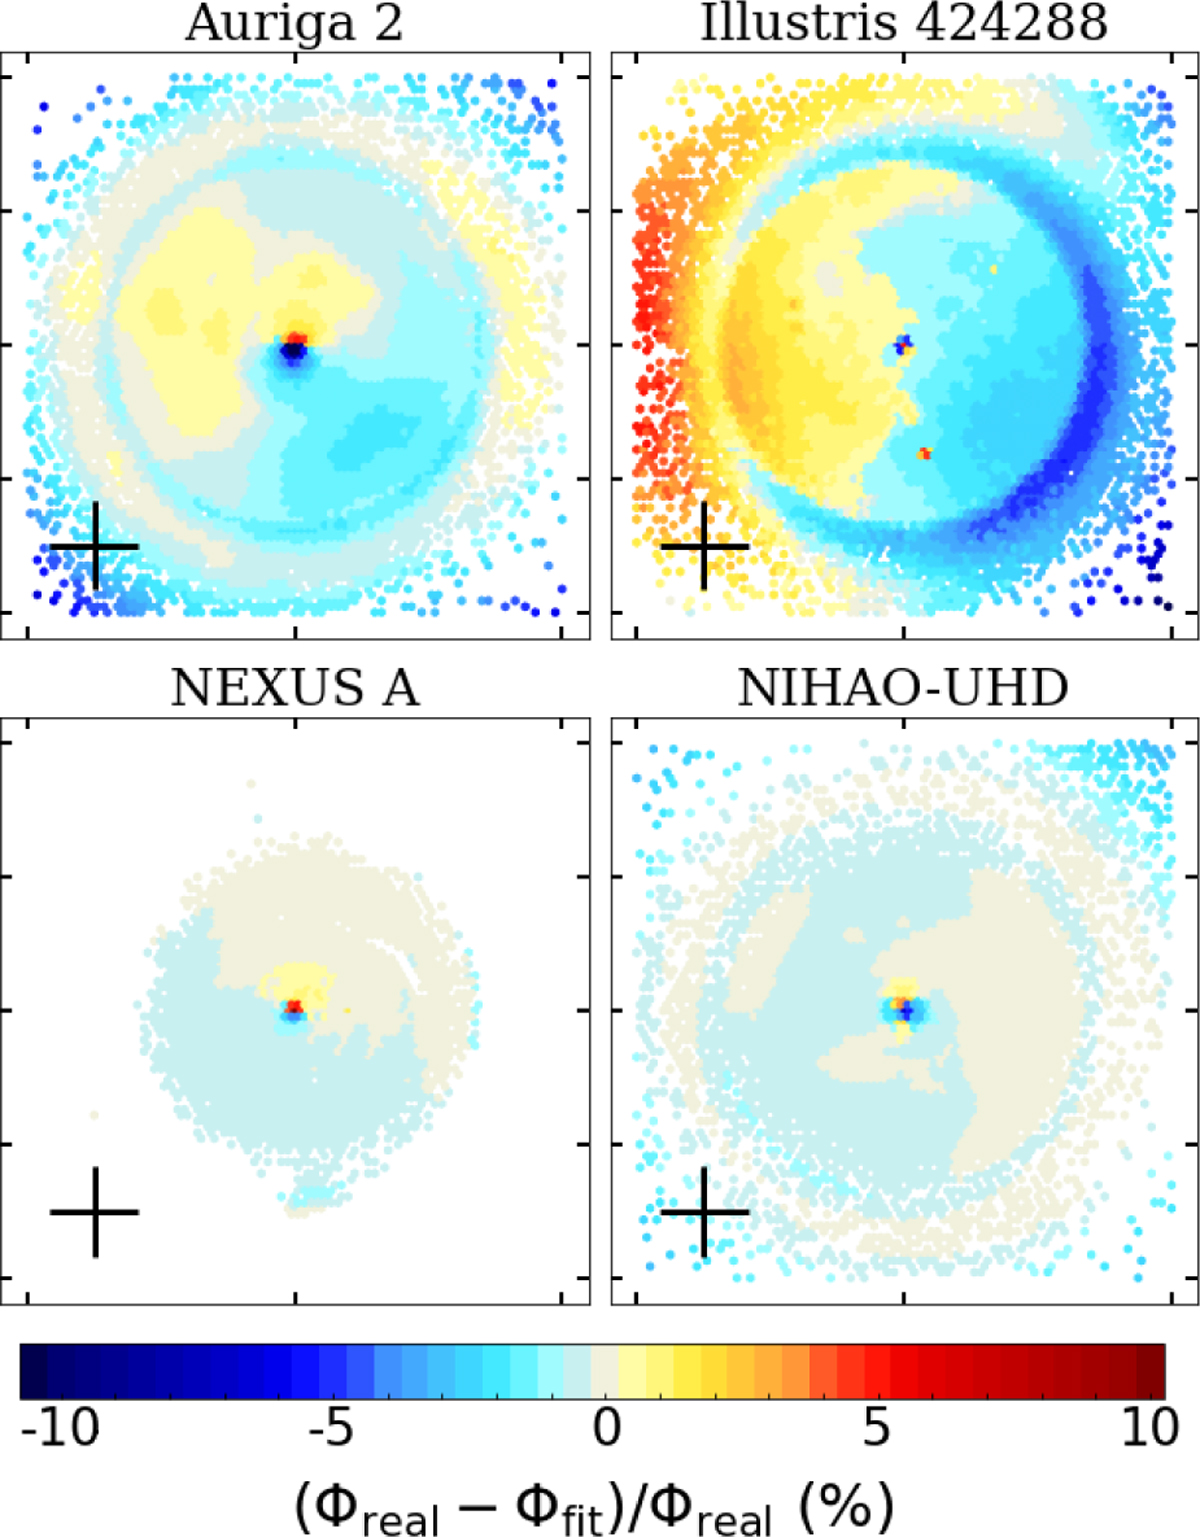
Relative residuals of the potential fits (in percentages) for one simulation from each group considered in this work. The cells show the most extreme relative discrepancy between the model and the nominal potential reported in the simulation within the range |Z| < Zlim. The black cross in the lower-left corner indicates the scale of ±10 kpc. The corresponding maps for the other simulations can be found in Figure A.1.
Current usage metrics show cumulative count of Article Views (full-text article views including HTML views, PDF and ePub downloads, according to the available data) and Abstracts Views on Vision4Press platform.
Data correspond to usage on the plateform after 2015. The current usage metrics is available 48-96 hours after online publication and is updated daily on week days.
Initial download of the metrics may take a while.