Fig. 5.
Download original image
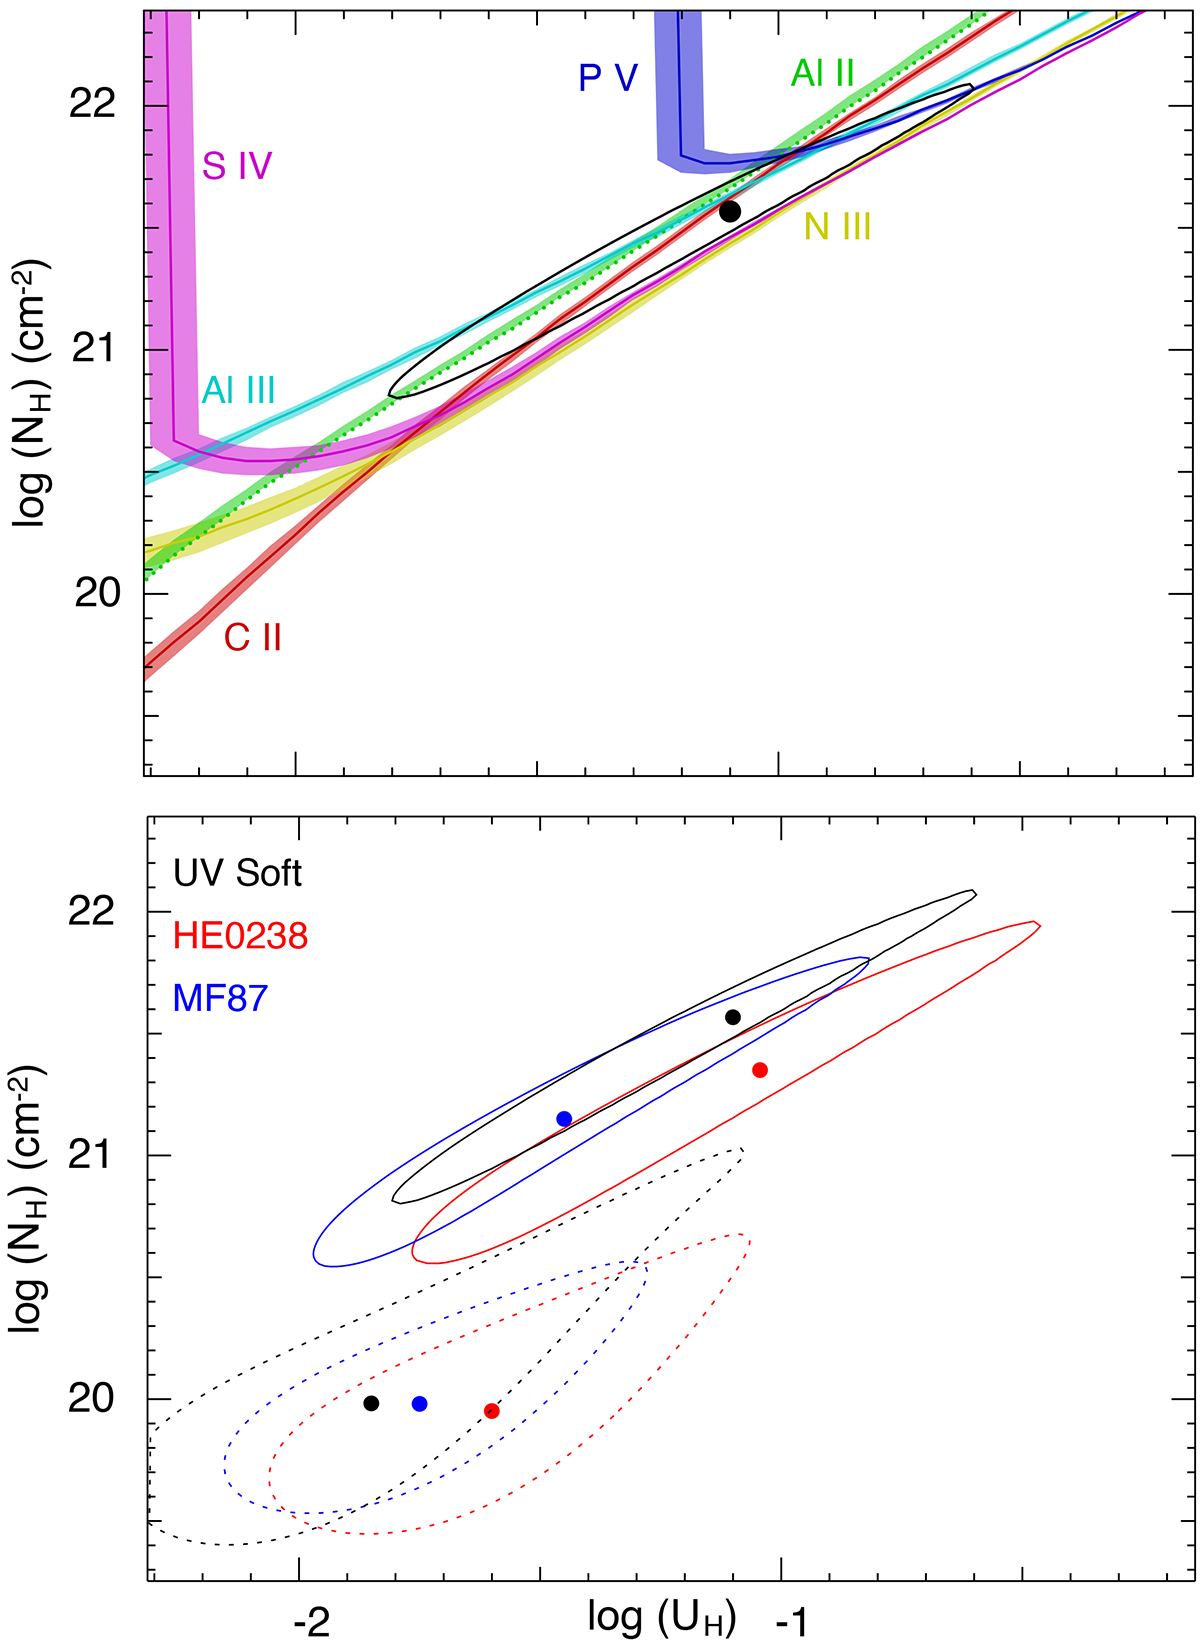
Phase plot showing the photoionization solution. Top: shows the solution for the absorption low-velocity outflow system in J1402, using the UV-soft SED and solar abundances. Each solid line represents the range of models (UH and NH) that predict a column density matching the observed value for that ion. The shaded bands are the uncertainties associated with each Nion measurement. The dotted line (Al II) represents an upper limit. The black dot shows the solution, which is surrounded by χ2, as the black oval. Bottom: solution for a total of six models, including three SEDs (HE0238, MF87, and UV-soft) and two abundances: solar (shown with solid lines) and super-solar (shown with dashed lines).
Current usage metrics show cumulative count of Article Views (full-text article views including HTML views, PDF and ePub downloads, according to the available data) and Abstracts Views on Vision4Press platform.
Data correspond to usage on the plateform after 2015. The current usage metrics is available 48-96 hours after online publication and is updated daily on week days.
Initial download of the metrics may take a while.