| Issue |
A&A
Volume 695, March 2025
|
|
|---|---|---|
| Article Number | L7 | |
| Number of page(s) | 11 | |
| Section | Letters to the Editor | |
| DOI | https://doi.org/10.1051/0004-6361/202453244 | |
| Published online | 05 March 2025 | |
Letter to the Editor
The variability of DDO68-V1, a unique, extremely metal-poor luminous blue variable
Special Astrophysical Observatory of RAS, Nizhnij Arkhyz, Karachai-Circassia, 369167, Russia
⋆ Corresponding author; This email address is being protected from spambots. You need JavaScript enabled to view it.
Received:
1
December
2024
Accepted:
21
February
2025
Abstract
Context. DDO68-V1 is a luminous blue variable (LBV) star in the eXtremely Metal-Poor (XMP) galaxy DDO68. It resides in the HII region with 12+log(O/H) ∼ 7.1 dex, or Z ∼ Z⊙/40. Since DDO68-V1 is the only known LBV with such a low initial metallicity, its in-deep study can give hints for understanding the LBV evolutionary stage and the nature of their powerful and highly variable mass loss in the very low-metallicity regime.
Aims. Our goal is to study the optical variability of DDO68-V1 during the last 36 years, with an emphasis on the period of the last 8 years, after the LBV giant eruption.
Methods. We used our published monitoring results in the B, V, and R bands of the total flux of HII region ‘Knot 3’, containing the LBV, along with photometry of the archive Hubble Space Telescope images, obtained in May 2010 and December 2017. This data allowed us to disentangle the variable light of DDO68-V1 and that of the underlying HII region.
Results. From all available photometry of Knot 3, we derived the V-band light curve of DDO68-V1 since 1988, with a higher cadence during the years 2015–2023, when the light curve resembles that of S Doradus.
Conclusions. The new data reveal the full range of DDO68-V1 absolute magnitudes MV of [−5.9, −10.8] mag. The LBV variations after the fading of the ‘giant eruption’ show the unusually large amplitude of δ V ≳ 3.0–3.5 mag on the timescale of ∼1–1.5 year. The apparent changes of the integrated B − V colour of Knot 3 are consistent with the expected colour variations of the LBV over the course of the S Doradus ‘normal eruptions’. These data, along with spectra of DDO68-V1, demonstrate the need for a higher-cadence photometry of DDO68-V1, in order to probe the possible periodicity in its light curve and binarity of the object. Such data, in turn, will stimulate the elaboration of the advanced models of the very metal-poor massive stars and their application to the study of the early Universe.
Key words: stars: evolution / stars: massive / stars: mass-loss / stars: individual: DDO68-V1 / stars: variables: S Doradus / galaxies: individual: DDO68 (UGC5340)
Publisher note: Reference Lupton et al. (2005) was incorrectly edited. The original version was put back on 14 March 2025.
© The Authors 2025
 Open Access article, published by EDP Sciences, under the terms of the Creative Commons Attribution License (https://creativecommons.org/licenses/by/4.0), which permits unrestricted use, distribution, and reproduction in any medium, provided the original work is properly cited.
This article is published in open access under the Subscribe to Open model. This email address is being protected from spambots. You need JavaScript enabled to view it. to support open access publication.
1. Introduction
Luminous blue variable (LBV) stars belong to the rather rare class of the evolved massive stars. The traditional view on LBVs is that they are a relatively short (several 105 or fewer years) transient and rather unstable stage of massive star evolution from the main-sequence hydrogen-burning O stars to the core-helium-burning Wolf-Rayet (WR) stars (Humphreys & Davidson 1994). They display evidence of strong mass loss via powerful non-stationary winds and eruptions that result in the formation of circumstellar shells with radii of a fraction of parsecs and more (e.g. Weis & Bomans 2020; Kniazev et al. 2016, and references therein). More resent data indicate that LBVs can evolve as the direct precursors of supernovae (SNe) (e.g. Petrov et al. 2016, and references therein). Moreover, as Smith (2017) argues, LBVs originate in massive binaries and are gainers of the binary co-evolution. The recent results of Mahy et al. (2022) give more support to this concept.
The great majority of known and candidate LBVs belong to the Milky Way, M31, M33, Magellanic Clouds, and other rather massive galaxies, and, hence, have solar or several times lower metallicities. Meanwhile, the study of the most metal-poor massive stars in the local Universe attracts much attention as related to our understanding of the processes of galaxy evolution and star formation feedback in the early Universe. This direction is currently supported by several new projects (e.g. Garcia et al. 2021; Gull et al. 2022; Lorenzo et al. 2022; Vink et al. 2023).
Probing the evolution of such massive stars via the properties of the most metal-poor LBVs is especially suitable thanks to the following two factors. First, due to their highly non-stationary mass loss, their properties should be more sensitive to the model assumptions and, thus, be helpful in the comparison of model predictions with the real, very-low-metallicity massive stars. Second, their observed relatively short timescales (years to decades) of the substantial changes of their evolutionary status, including giant eruptions, impostor and SN explosions (e.g. Petit et al. 2006; Smith et al. 2016; Guseva et al. 2022; Aghakhanloo et al. 2023), make them especially valuable observational targets for monitoring programmes.
The issue of the extremely metal-poor massive star evolution remains crucial for understanding galaxy formation and evolution for the time of ≲1 Gyr since the Big Bang (e.g. Eldridge & Stanway 2022, and references therein). While the state-of-art stellar evolution models, including those with a fast rotation, have advanced in recent years (e.g. Szecsi et al. 2015; Chen et al. 2015; Sanyal et al. 2017; Vink 2022, and references therein), there is no direct comparison of the model predictions with properties for the real, extremely metal-poor, massive stars reported. The main reason is the lack of such stars in the local Universe which would be accessible for sufficiently detailed studies. The qualitative progress in the accessibility of the faint targets is expected with the upcoming next-generation, extremely large optical telescopes. As a preparatory step for the future detailed studies, the search for such rare massive stars and an examination of their available properties appear timely and necessary.
The Lynx-Cancer void (Pustilnik & Tepliakova 2011) galaxy DDO68 (UGC5340) is known as a peculiar morphology dIrr (e.g. Pustilnik et al. 2005, 2017; Ekta et al. 2008; Annibali et al. 2019b) with a number of prominent young star-forming (SF) regions. Several of them have the almost record-low metallicity: 12+log(O/H) = 6.98–7.10 dex. Most of its SF regions are found at the periphery, mainly in the ‘northern ring’ and the ‘southern tail’ (Pustilnik et al. 2005; Izotov & Thuan 2007; Annibali et al. 2019b). In the repeat observations of DDO68, the unique LBV star was discovered in one of the most metal-poor HII regions in the local Universe (Pustilnik et al. 2008; Izotov & Thuan 2009).
In this Letter, we present and discuss the light curve of the LBV DDO68-V1 (the LBV that originated from the gas with a metallicity of ∼Z⊙/40), which is clearly evidence of its recent ’giant eruption’ and the light variations afterwards, resembling the S Doradus-type normal eruptions.
The layout of the Letter is as follows. In Sect. 2, we present all the used ground-based observational data on the aperture photometry as well as the direct photometry of DDO68-V1 at the Hubble Space Telescope (HST) images in May 2010 and December 2017. In Sect. 3, the main results of data processing and analysis are presented. Sect. 4 is devoted to a discussion of the new results, their comparison with the previous data, and understanding them in a wider context. In Sect. 5, we summarise the new results and draw the main conclusions. The details of the data and their analysis and tables with the original photometric series of Knot 3 and the derived magnitudes of the LBV are presented in the ‘supplementary materials’ as Appendices A, B, and C. The distance to DDO68 was adopted according to the ‘tip of red giant branch’ (TRGB) based estimate from Makarov et al. (2017) of 12.75 kpc. The latter is close to that from Sacchi et al. (2016), Annibali et al. (2019a). The respective scale is 62 pc in 1″.
2. Observational data
2.1. Ground-based data
The ground-based observations and data processing as well as the results of photometry of region Knot 3 (among the other five regions) are described in detail in Pustilnik et al. (2024). They are also briefly summarised in our supplementary materials (Appendix B). Our photometry was obtained in 35 nights during the period from March 2016 to October 2023, mostly with SAO RAS 6 m (BTA) and 1 m telescopes and with the 2.5 m telescope of the Caucasian Mountain Stations of Moscow State University. It was complemented by some of our earlier data from BTA and by the data collected from the archive images of ten telescopes worldwide. The earlier and archive data were re-analysed in the same way as our new observations. Therefore, the results in Table C.1 are slightly different from those in Table 2 of Pustilnik et al. (2017). More details are given at the end of Appendix B.
The aperture photometry of DDO68 HII region Knot 3 on all images was based on the local standard stars. A half dozen sufficiently bright stars (g = 17.9m − 20.5m) were selected in the Sloan Digital Sky Survey (SDSS) (Abazajian 2009) images in the vicinity of DDO68-V1. Their g, r, and i magnitudes were transformed to the Johnson-Cousins B, V, and R magnitudes according to the Lupton et al. (2005) relations.
2.2. HST data
The HST data used for this work are the deep images in filters F606W and F814W, obtained in May 2010 and December 2017, for the programmes ID 11578 (PI: A.Aloisi) and ID 14716 (PI: F.Annibali), respectively. We used the photometry and the derived V and I magnitudes of the fifty most luminous stars in the 2010 HST Advanced Camera for Surveys (ASC) image as presented in Pustilnik et al. (2017). The images in December 2017 were obtained with the Wide Field Camera 3, twice in each of the filters. The total exposure times for both filters were of 7280 s for one pair, and 5116 s – for the other pair. The lag between the images in F606W is 13 days, and 19 days for images in F814W. The photometry of objects of interest in the 2017 HST image was performed for this study, with all details being presented in our supplementary material (Appendix A). Briefly, we performed the two main procedures.
The first one is the two-Gauss fitting of the 1d scan through the image of the close ‘pair’ at the position of DDO68-V1. This allowed us to determine the relative fluxes of the two stars in the pair and to connect their position to the nearby stars. This allowed us, after comparison of the LBV position in the HST image in May 2010, to fix that in December 2017 with the LBV being the fainter of these two stars.
The second procedure was to determine the V and I apparent magnitudes of the above stars. This was done via the aperture photometry of the pair and of 35 out of 50 supergiants from Pustilnik et al. (2017). The latter 35 stars were selected as clearly isolated from other stars, so that their aperture photometry should be reliable. These 35 stars with known V and I magnitudes were used as the local standards in the 2017 HST images in order to determine the respective zero points in both V and I bands. Applying these zero points to the instrumental magnitudes of the total light of the pair, we obtained its total V and I magnitudes. Having the flux ratio from the above two-Gauss fitting, we finally derived the V magnitudes of both stars and their colour (V − I). We also tried to use the DOLPHOT PSF photometry, but due to the systematical differences between the two epochs, we chose the current variant. For more details, readers can refer to Appendix A.
3. Results
The main results of this study are presented in more detail in the supplementary materials. Here we summarise them briefly.
3.1. Results from HST images
As mentioned in the previous section, we used the HST images obtained in December 2017. We decomposed the non-stellar images of the object at the position of DDO68-V1 with the two-Gauss fitting and got the relative fluxes of the two adjacent stars. Then we performed the aperture photometry of this non-stellar object. Finally we transformed its instrumental magnitudes to the apparent V and I ones, using the zero points in each of the HST images as explained in the previous section. Readers can refer to Appendix A for more details.
The brighter star of the two, with V = 23.99 ± 0.05, MV, 0 = −6.90 mag, and the colour (V − I)0 = −0.109 ± 0.115, can be assigned to the B5-B8 supergiant (e.g. Wegner 1994; Ducati et al. 2001). For DDO68-V1 at this epoch, we derived V = 25.00 ± 0.12 mag. With the absolute value of MV, 0 = −5.89 mag and the colour (V − I)0 = −0.31 ± 0.34, the LBV near the minimum is similar to an early (about B1) B supergiant (Ducati et al. 2001). However, due to a rather large uncertainty for its colour index, the LBV effective temperature in this phase can range between that for O5 to a late B supergiant (Wegner 1994; Ducati et al. 2001). The better accuracy for the LBV colours is necessary to constrain its spectral class near the minimum. The other direct estimate of the LBV magnitude (V = 20.05) in the May 2010 HST image (Pustilnik et al. 2017) implies the minimal registered amplitude of the LBV light variations of δ V ≳ 5.0 mag.
Since, for the December 2017 HST data, we have two independent images for each of the filters, we could check possible light variations of DDO68-V1 on the timescales of 2–3 weeks. The respective upper limit for variations of DDO68-V1 during this period is δV ≲ 0.03 mag. For more details, readers can refer to Appendix A.
3.2. DDO68-V1 light curve from the ground-based photometry
In Table C.1, we summarise all our photometric data on the integrated magnitudes of Knot 3. We suggest that, at first approximation, the total light of Knot 3 is composed of the (almost) non-variable light of the related HII region and of many unresolved stars within the used aperture (radius of 2.5 arcsec), and the variable light of DDO68-V1. In this approximation, we can get the flux of the LBV at the respective epochs via the subtraction of the non-variable light of the ‘underlying complex object’ from the measured total light of Knot 3. The magnitude of this non-variable object can be determined iteratively, based on the faintest measured V mag of Knot 3 in Table C.1.
In particular, during the 2005 Jan. 12 epoch, when the first spectra of Knot 3 were obtained, they demonstrated the purely HII region emission lines, with no indication of an LBV emission contribution (Pustilnik et al. 2005). Its V mag of 20.19 ± 0.013 on this date defines the upper limit to the light of the non-variable object. Its real level should be at least several 0.01 mag fainter, in order for the residual flux of the LBV to remain at a reasonable level. That is, its MV, 0 is brighter than −5.8 mag, corresponding (with the account for AV = 0.36 within the H II region) to V(LBV)∼25.0). The iteration procedure leads to the level of this non-variable ‘background’ light at Vback = 20.23–20.24 mag. For more details, readers can refer to Appendix B. In Fig. B.1, we show the resulting V-band light curve of DDO68-V1 in the three time intervals. The effect of the choice of Vback is also illustrated (Vback = 20.23 and Vback = 20.24). The direct estimates of V(LBV) in the HST images for epochs from May 2010 and December 2017 are overplotted as well.
As one can see, a slightly fainter level for the background component substantially affects the minima of the LBV light curve, somewhat reducing the amplitude of the variations after the giant eruption. However, if we tried to further reduce the level of Vback, for example to ∼20.25 mag, all of the ground-based minima of the LBV light curve would shift upwards by about a half magnitude or more. This led to the situation of the HST-defined minimum becoming too deep in comparison to the other minima. While we cannot exclude such a case completely, it is much more likely that the HST-based minimum is similar to the minima detected from the ground-based photometry. Therefore, we consider the level of Vback = 20.23–20.24 mag for the non-variable background as being close to real.
In Table C.2, we present the derived V-band values for the sum (LBV+BSG) with their errors, which were transferred from the errors of V(Knot 3) in Table C.1. We provide the estimates for V mag and their errors are given for the LBV itself, after subtracting the light of the neighbour BSG. The latter errors were transferred from the errors of V(LBV+BSG). In Fig. B.1, the large errors of V(LBV) (σV, LBV > 1 mag) near the minima of the light curve were artificially reduced to keep the frame range more compact.
3.3. DDO68-V1 colours
For some of the ground-based observations, we have simultaneous measurements in two or three bands (B, V, and R). So, we could probe the possible trends of the colour variations versus the total luminosity of Knot 3, which, in turn, were correlated with variations of DDO68-V1. Readers can refer to Appendix C and Fig. C.1 for more details.
In brief, there are indeed some systematic trends in the colour variations of Knot 3 in the period after the giant eruption. The colours of Knot 3 change substantially from the minima to the local maxima of the light curve. The reddening of the (B − V) colour with the increase of the Knot 3 brightness can be consistent with the commonly adopted cooling of the LBV ‘photosphere’ from a blue supergiant to F supergiant. However, the (V − R) colour of Knot 3 gets bluer near the local maxima. This can be related to a variable contribution of Hα emission in the LBV. Readers can refer to Appendix C for more details.
4. Discussion
As mentioned above, DDO68-V1 is the only known LBV with an initial, extremely low metallicity (Z(gas) ∼ Z⊙/40). Therefore, understanding its properties is very important for comparison with model predictions of the very low-Z massive star evolution. However, its brightness, excluding the period of the giant eruption event, is mostly too low for its high-resolution spectroscopy. So, the detailed spectral study of this LBV will require particular effort and the use of either HST, or the upcoming extremely large telescopes.
The situation, however, is much better for studying its light and SED variations. The LBV is caught during the giant eruption, and also is registered afterwards, during a period of about eight years, when it displayed the light variations resembling those of S Doradus-type variables. We present the light curve of DDO68-V1 in the V band in Fig. B.1 and briefly discuss its features below. We also mention the B-band photometry of Bomans & Weis (2011) for Knot 3 [12 epochs in 1955–2007], which, however, shows the B magnitudes substantially fainter relative to ours in the close epochs.
The main features of the presented light curve are: 1) the ‘giant eruption’, which reached the brightness peak of V ∼ 20.0 mag (corresponding to MV ∼ −10.8 mag) near the middle of 2010, and 2) the quasi-regular light variations after the giant eruption, in the period since 2015. In course of the giant eruption, the brightness of DDO68-V1 increased by ∼2.2 mag relative to the median level (V ∼ 22.2 mag), and by ∼5 mag relative to the deep minima of the light curve. The duration of the giant eruption is about 6.5 years, if we define it by the light curve intersections of the median line near 2006.5 and 2013. The first signs of the broad emission lines, related to the giant eruption, were detected only in January 2008.
It is interesting that both the beginning and the ‘end’ of the giant eruption are rather close in time to two deep minima in the light curve, in the beginning of 2005 and in 2015. Another curious feature of the LBV spectral behaviour over the course of the giant eruption fading is the detection in its spectrum of the substantially diminished broad Hα in April 2016 by Guseva et al. (2022). This appeared within a year after the deep minimum in 2015, and, in fact, very close to the local maximum of the subsequent large variations. While this broad line could be some residual emission of the strongly faded shell, this and alternative options require a more careful analysis. This broad component of Hα faded completely, however, after two more years.
The light variations since 2015 were not perfectly sampled. However, their main features can be uncovered and summarised as follows. Of the 32 DDO68-V1 magnitude estimates for this time range, only five points relate to the evident minima, with the magnitude range from their nearest maximum of ∼3.0–3.5 mag. Probably two more minima are present in the light curve with the amplitudes of ∼1 mag. The characteristic times of the fall to a minimum and the rise after it range from ∼0.2 to ∼1 year. While one cannot exclude the effect of small statistics, all five minima during this period are registered by only a singular measurement, which indicates their relatively short duration of ≲0.5 year. A good example is the deep HST-based minimum in December 2017. This combines four HST measurements in V and I filters for 3 weeks and the adjacent intermediate brightness point in mid-November 2017. The two adjacent local maxima, in May 2017 and Feb. 2018, are separated by only 9 months.
As opposed to this, the local maxima can be defined by several points with a total duration of about 1 year (as in periods from March 2016 – June 2017, Feb. 2018 – Feb. 2019, and Dec. 2022 – Oct. 2023). Clearly, higher-cadence data with a more regular time coverage would be helpful to better characterise the light curve of DDO68-V1. In general, from the presented picture of the whole light curve, during the last 36 years since 1988, the LBV has been in an ‘agitated’ state. Of the 44 LBV magnitudes shown, only six are in fact close to the minima of the light curve, corresponding to the quiescent state. Despite the amount of observational data for DDO68-V1 being modest, it is useful to make a preliminary comparison with other well-studied LBVs with giant eruptions or with clearly visible S Dor variability.
There are LBS in two galaxies with the nearest (but much larger) metallicity to that of DDO68. These are LBVs in PHL293B and NGC2363-V1, with 12+log(O/H) = 7.71 and 7.90 dex. Both of them were caught during their giant eruptions.
For the LBV in PHL 293B, with the maximum MV ∼ −12 mag, the giant eruption lasted at least ∼16 years (Guseva et al. 2022). The broad component of Hα was detected for the first time in the SDSS spectrum in 2001. In 2019, based on the disappearance of the broad Hα, this giant eruption is claimed to have faded (Allan et al. 2020). However, according to the spectrum, obtained by Guseva et al. (2022) in November 2020, the broad Hα is still present. No information was published on the optical variability of this LBV before the giant eruption.
NGC2363-V1 was observed with the HST in both spectral and photometric modes, during the period of its maximal light, when it brightened by ∼3.5–4 mag and reached MV ∼ −10.5 mag (Drissen et al. 2001; Petit et al. 2006). The LBV brightened from the ‘low state’ to the ‘flat’ part of the giant eruption in about 2 years, and then it experienced small fluctuations at this level with the very slow fading in V band, but brightening in UV, during ∼10 years (1995–2005). Since no information has been published on its light curve after 2005, neither the duration of the giant eruption nor the type of NGC 2363-V1 light curve after its end are known.
Thus, the duration of the giant eruption in DDO68-V1 is two-three times shorter than for the two ‘similar’ LBVs. As for their type of variability after the giant eruptions, no such information is available.
The light curve of DDO68-V1 after the giant eruption, during the years 2015–2023, is better sampled and can be, in principle, compared with the light curves of the known LBV stars and monitored for decades. One such example is a well-known S-Doradus variable, AG Car. Its about 30 year-long light curve was presented by Sterken (2003). AG Car displays the ‘short-term’ (∼1 year) variations with amplitudes of ∼0.5–1.5 mag and the underlying variations with the characteristic time of ∼15 years. The analysis of its variability reveals a period of P ∼ 370 days.
If we compare the ‘regular’ light variations in DDO68-V1 on a 1-year timescale with the light curves of the other known S Doradus-type LBVs (e.g. AG Car, HR Car, R127, and GR290; Sterken 2003; Smith et al. 2020; Walborn et al. 2008; Polcaro et al. 2016), we find that its amplitude of 3.0–3.5 mag far exceeds the typical amplitudes of the known LBVs, of ∼1–2 mags. There are two factors that could be related to the observed elevated amplitude of DDO68-V1 variations. The first one can be due to the post-giant-eruption processes in the LBV, so that the amplitude will decrease in years or decades. The second factor can be related to the very low metallicity of the LBV stellar material. It is also possible that both factors contribute to the enhanced amplitude of DDO68-V1 S Dor-type variations.
In addition, the ‘regular’ variations of DDO68-V1 after the giant eruption, on a timescale of ∼1 year, may resemble the unusual high amplitude and a rather short duty cycle (∼200 days) behaviour of an LBV in NGC 3432 (SN impostor SN 2000ch) (Pastorello et al. 2010; Aghakhanloo et al. 2023). For this rare type of variability, Aghakhanloo et al. (2023) find very clear evidence of periodicity, which indicates the effect of periastrons in a binary system.
5. Summary and conclusions
Summarising the presented results and the discussion above, we emphasise the feasibility of the ground-based photometry of DDO68-V1. While the conducted observations were of a rather low cadence and not of the best quality as they could have been in the case of a more dedicated programme, they resulted in an interesting outcome and paved the way for a more advanced study of this unique LBV star. To check the possible binarity, that is, the hidden periodical component in the LBV light variations, a two-week or smaller cadence is required for observations. Its monitoring in several broad-band filters with a typical accuracy of ≲0.01 mag should be adequate to get substantially improved observational material and a deeper analysis of the LBV properties. The correlated variations in several filters should ease the search for periodicity and allow one to study the colour variations. As our work demonstrates, this task can be accomplished with telescopes of 1–2 metre class. In addition, since the LBV reaches a brightness level of V ≲ 22 mag in the local maxima of the ‘S Doradus-type’ light curve, one can use big telescopes to perform spectroscopy of the LBV in these phases.
Our conclusions can be formulated as follows:
-
1.
The unique LBV DDO68-V1 was discovered in January 2008 in the void galaxy DDO68, in the HII-region with the almost record-low metallicity of 12+log(O/H) ∼ 7.1. We updated its earlier-published scarce light curve for the period of 2005–2015 from Pustilnik et al. (2017), adding our new (since the year 2016) SAO 6 m and 1 m telescopes and CMO 2.5 m telescope photometry of Knot 3 and the photometry from archive images with ten different telescopes over the period of 1988–2013. The present photometry over the last 36 years during 44 epochs reveals that the LBV is rather active during this period, remaining in the ‘low’ state only during six ‘short’ intervals with a duration of ≲1 year.
-
2.
All accumulated data allowed us to determine the reliable amplitude of this LBV light curve. In the V band, it varied during the last three decades in the range of ∼20.0–25.0 mag or fainter. This corresponds to a MV range of ≳ − 5.9 to −10.8 mag. The major brightening of the LBV took place in 2009–2011, with the subsequent fading by ∼2 mag by 2013. Combining this brightening with the uprise of the broad emission lines and the P Cyg-type absorptions with a terminal velocity of ∼800 km s−1, this event is classified as the giant eruption, which is related to the strong episodic mass loss, similar to the η Car phenomenon.
-
3.
The monitoring of DDO68-V1 for 8 years after the end of the giant eruption reveals ‘regular’ light variations, resembling those of S Doradus, which are considered to be typical of LBVs. Thus, these data hint that DDO68-V1 does indeed demonstrate signs of bona fide LBVs. However, the amplitude of these ‘regular’ variations reaches ∼3–3.5 mag, which is substantially larger than for the known LBVs with well-sampled light curves.
-
4.
The results of the study of DDO68-V1, presented in this work, are very promising, but the statistics of the variability is rather poor. Taking into account the unique status of this XMP LBV, in order to get deeper insights into its properties, we suggest a wide collaboration of its high-cadence (1.5–2 weeks) multiband monitoring during the next several years. This will allow one to better understand the characteristic times and amplitudes, to probe its potential binarity via the uncovered periodic signal (probably hidden due to the internal LBV processes), and to clear up the trends in its colour changes. These data will pave the way to better understand the massive evolved stars with the lowest metallicities, which are the analogues of massive stars in the early Universe.
Acknowledgments
The results of this research are obtained with the financial support of grant No. 075-15-2022-262 (13.MNPMU.21.0003) of the Ministry of Science and Higher Education of Russian Federation. Observations at the 6-m telescope BTA are supported by funding from the Ministry of Science and Higher Education of Russian Federation (agreement No 14.619.21.0004, project identification RFMEFI61914X0004). We thank A. Vinokurov and A. Kniazev for their useful comments on the earlier version of the paper. We also thank the anonymous referee for their comments. We acknowledge the use of the SDSS database. Funding for the SDSS has been provided by the Alfred P. Sloan Foundation, the Participating Institutions, the National Aeronautics and Space Administration, the National Science Foundation, the U.S. Department of Energy, the Japanese Monbukagakusho, and the Max Planck Society. The SDSS Web site is http://www.sdss.org/. The SDSS is managed by the Astrophysical Research Consortium (ARC) for the Participating Institutions.
References
- Abazajian, K. N., et al. 2009, ApJS, 182, 543 [NASA ADS] [CrossRef] [Google Scholar]
- Aghakhanloo, M., Smith, N., Milne, P., et al. 2023, MNRAS, 521, 1941 [NASA ADS] [CrossRef] [Google Scholar]
- Allan, A. P., Groh, J. H., Mehner, A., et al. 2020, MNRAS, 496, 1902 [NASA ADS] [CrossRef] [Google Scholar]
- Annibali, F., Bellazzini, M., Correnti, M., et al. 2019a, ApJ, 883, 19 [NASA ADS] [CrossRef] [Google Scholar]
- Annibali, F., La Torre, V., Tosi, M., et al. 2019b, MNRAS, 482, 3892 [NASA ADS] [CrossRef] [Google Scholar]
- Bomans, D. J., & Weis, K. 2011, Bulletin de la Societe Royale des Sciences de Liège, 80, 341 [Google Scholar]
- Chen, Y., Bressan, A., Girardi, L., et al. 2015, MNRAS, 452, 1068 [Google Scholar]
- Crowther, P. 2004, in Evolution of Massive Stars, Mass Loss and Winds, eds. M. Heydary-Malayeri, P. h. Stee, & J. P. Zahn, EAS Publications Series, 13, 119 [NASA ADS] [Google Scholar]
- Drissen, L., Crowther, P. A., Smith, L. J., et al. 2001, ApJ, 546, 481 [NASA ADS] [Google Scholar]
- Ducati, J. R., Bevilacqua, C. M., Rembold, S. B., & Ribeiro, D. 2001, ApJ, 558, 309 [NASA ADS] [CrossRef] [Google Scholar]
- Ekta, B., Chengalur, J. N., & Pustilnik, S. A. 2008, MNRAS, 391, 881 [NASA ADS] [CrossRef] [Google Scholar]
- Eldridge, J. J., & Stanway, E. E. 2022, ARA&A, 60, 455 [NASA ADS] [CrossRef] [Google Scholar]
- Garcia, M., Evans, C. J., Bestenlehner, J. M., et al. 2021, Experimental Astronomy, 51, 887 [NASA ADS] [CrossRef] [Google Scholar]
- Grassitelli, L., Langer, N., Mackey, J., et al. 2021, A&A, 647, A99 [NASA ADS] [CrossRef] [EDP Sciences] [Google Scholar]
- Gull, M., Weisz, D. R., Senchyna, P., et al. 2022, ApJ, 941, 206 [NASA ADS] [CrossRef] [Google Scholar]
- Guseva, N. G., Thuan, T. X., & Izotov, Y. I. 2022, MNRAS, 512, 4298 [NASA ADS] [CrossRef] [Google Scholar]
- Humphreys, R. M., & Davidson, K. 1994, PASP, 106, 1025 [NASA ADS] [CrossRef] [Google Scholar]
- Izotov, Y. I., & Thuan, T. X. 2007, ApJ, 665, 1115 [NASA ADS] [CrossRef] [Google Scholar]
- Izotov, Y. I., & Thuan, T. X. 2009, ApJ, 690, 1797 [NASA ADS] [CrossRef] [Google Scholar]
- Kniazev, A. Y., Gvaramadze, V. V., & Berdnikov, L. N. 2016, MNRAS, 459, 3068 [NASA ADS] [CrossRef] [Google Scholar]
- Lorenzo, M., Garcia, M., Najarro, F., et al. 2022, MNRAS, 516, 4164 [NASA ADS] [CrossRef] [Google Scholar]
- Lupton, R., et al. 2005, https://www.sdss3.org/dr8/algorithms/sdssUBVRITransform.php#Lupton2005 [Google Scholar]
- Mahy, L., Lanthermann, C., Hutsemékers, D., et al. 2022, A&A, 657, 15 [Google Scholar]
- Makarov, D. I., Makarova, L. N., Pustilnik, S. A., & Borisov, S. B. 2017, MNRAS, 466, 556 [CrossRef] [Google Scholar]
- Pastorello, A., Boticella, M. T., Trundle, C., et al. 2010, MNRAS, 408, 181 [NASA ADS] [CrossRef] [Google Scholar]
- Petit, V., Drissen, L., & Crowther, P. A. 2006, AJ, 132, 1756 [NASA ADS] [CrossRef] [Google Scholar]
- Petrov, B., Vink, Y., & Gräfener, G. 2016, MNRAS, 458, 1999 [NASA ADS] [CrossRef] [Google Scholar]
- Polcaro, V. F., Maryeva, O., Nesci, R., et al. 2016, AJ, 151, 149 [NASA ADS] [CrossRef] [Google Scholar]
- Pustilnik, S. A., & Tepliakova, A. L. 2011, MNRAS, 415, 1188 [NASA ADS] [CrossRef] [Google Scholar]
- Pustilnik, S., Kniazev, A., & Pramskij, A. 2005, A&A, 443, 91 [NASA ADS] [CrossRef] [EDP Sciences] [Google Scholar]
- Pustilnik, S. A., Tepliakova, A. L., Kniazev, A. Y., & Burenkov, A. N. 2008, MNRAS, 388, L24 [NASA ADS] [CrossRef] [Google Scholar]
- Pustilnik, S. A., Makarova, L. N., Perepelitsyna, Y. A., Moiseev, A. V., & Makarov, D. I. 2017, MNRAS, 465, 4985 [CrossRef] [Google Scholar]
- Pustilnik, S. A., Perepelitsyna, Y. A., Vinokurov, A. S., et al. 2024, Astrophys. Bull., 79, 594 [NASA ADS] [CrossRef] [Google Scholar]
- Sacchi, E., Annibali, F., Cignoni, M., et al. 2016, ApJ, 830, 3 [CrossRef] [Google Scholar]
- Sanyal, D., Langer, N., Szecsi, D., Yoon, S.-C., & Grassitelli, L. 2017, A&A, 597, A71 [NASA ADS] [CrossRef] [EDP Sciences] [Google Scholar]
- Schlafly, E. F., & Finkbeiner, D. P. 2011, ApJ, 737, 103 [Google Scholar]
- Smith, N. 2014, ARA&A, 52, 487 [NASA ADS] [CrossRef] [Google Scholar]
- Smith, N. 2017, Phil. Trans. R. Soc. A, 375, 20160268 [CrossRef] [Google Scholar]
- Smith, N., & Owocki, S. P. 2006, ApJ, 645, L45 [NASA ADS] [CrossRef] [Google Scholar]
- Smith, N., Andrews, J. E., Mauerhan, J. C., et al. 2016, MNRAS, 455, 3546 [Google Scholar]
- Smith, N., Aghakhanloo, M., Murphy, J. W., et al. 2019, MNRAS, 488, 1760 [NASA ADS] [CrossRef] [Google Scholar]
- Smith, N., Andrews, J., Moe, M., et al. 2020, MNRAS, 492, 5897 [NASA ADS] [CrossRef] [Google Scholar]
- Spoon, H. W. W., de Koter, A., Sterken, C., Lamers, H. J., & Stahl, O. 1994, A&AS, 106, 141 [NASA ADS] [Google Scholar]
- Sterken, C. 2003, ASP Conf. Ser., 292, 437 [NASA ADS] [Google Scholar]
- Szecsi, D., Langer, N., Yoon, S.-C., et al. 2015, A&A, 581, A15 [NASA ADS] [CrossRef] [EDP Sciences] [Google Scholar]
- Tikhonov, N., Galazutdinova, O., Sholukhova, O., et al. 2021, Res. Astron. Astrophys., 21, 098 [CrossRef] [Google Scholar]
- Vink, J. S. 2022, ARA&A, 60, 203 [NASA ADS] [CrossRef] [Google Scholar]
- Vink, J., Mehner, A., Crowther, P., et al. 2023, A&A, 675, A154 [NASA ADS] [CrossRef] [EDP Sciences] [Google Scholar]
- Walborn, N., Stahl, O., Carmen, R., et al. 2008, ApJ, 683, L33 [NASA ADS] [CrossRef] [Google Scholar]
- Weis, K., & Bomans, D. J. 2020, Galaxies, 8, 20 [NASA ADS] [CrossRef] [Google Scholar]
- Wegner, W. 1994, MNRAS, 270, 279 [Google Scholar]
- Williams, B. F., Lang, D., Dalcanton, J. J., et al. 2014, ApJS, 215, 9 [Google Scholar]
Appendix A: HST images of DDO68-V1 in 2010 and 2017. Deblending light of the neighbour supergiant.
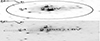 |
Fig. A.1. Part of the HST image of DDO68 in F606W filter, centred on the SF region Knot 3 with the LBV DDO68-V1 near its centre. The aperture, used for the ground-based photometry, is superimposed as a cycle with Daper= 5″. Arrows show directions to the north and east. Top panel: Epoch of May 2010 (Program ID 11578, PI: A.Aloisi). Bottom panel: Epoch of December 2017 (Program ID 14716, PI: F.Annibali). The shown rectangular with width of 7 pixels (0.28 arcsec) is extracted and its light is summed-up along Y direction to perform 1D two-Gauss fitting of DDO68-V1 region. See details in Appendix A. |
In both filters, F606W and F814W, there is a clear indication on the asymmetric appearance of the object at the position of DDO68-V1 in the HST images on the epoch of December 2017. The position of DDO68-V1 is defined at the HST image on the epoch of May 2010 (Fig. A.1, top panel), when the LBV was near the peak of its brightness. We rotate the original HST image by ∼120° counterclockwise, so that the direction from the LBV to stars No. 9 and No.24 would coincide with X axis. We then extract the rectangular box along the X direction, as shown in Fig. A.1 (bottom panel) (the width of 7 pixels) and summ-up the signal over these 7 pixels, to produce an 1D scan of the region of interest. Its width corresponds to ∼2.5 FWHM of a stellar image.
We then perform the procedure ’blendfit’ from MIDAS, to fit the 1D brightness profile of the object near the LBV position by two Gaussians. We fix the width of the Gaussian to be equal to the width of two other stars visible on the 1D scan (No. 9 with V=23.38 mag and No. 24 with V=24.30 mag, where their nomenclature is from Pustilnik et al. (2017)), namely at 2.85 pixels (or ∼0.11 arcsec). We than vary the relative amplitudes and the distance between the two components to get the best χ2 parameter and the least value of residuals (see Fig. A.3).
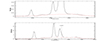 |
Fig. A.2. Top panel: 1D scan of brightness in V-band near DDO68-V1 on the epoch of May 2010. Bottom panel: Same as in the left-hand panel, but for the epoch of December 2017. Red solid line shows the level of the underlying background, above which the two-Gauss fitting was performed, as shown in the left panel of Fig. A.3. |
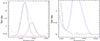 |
Fig. A.3. Left-hand panel: Two-Gauss fitting to the V-band brightness profile near the position of DDO68-V1 for the epoch of December 2017. Right-hand panel: Residual signal of the accepted two-Gauss fitting. See parameters of the components in the text. |
The results of the two-Gauss fitting in the HST images at the epoch of December 2017 allow one to determine the ratio of fluxes of the both components, as well as their relative positions, and to tie their positions to that of the LBV in the HST image on the epoch of May 2010. Having the instrumental magnitudes in both F606W and F814W filters, derived from the aperture photometry of this complex object, we use the respective zero points, as described below, and obtain its Johnson-Cousins V=23.630±0.005 mag and I=23.627±0.008 mag. The close estimate of V = 23.7 mag for this object, without error estimate, was presented by Tikhonov et al. (2021). From these ’total’ magnitudes we finally derive V and I-band magnitudes of the both components, the LBV and its very close neighbour star (δX = 2.85 px = 0.114 arcsec, or projected distance of 7 pc).
The respective zero points are determined from the known V and I magnitudes of the fifty the most luminous supergiants distributed along the DDO68 ’northern ring’ HII regions. Their magnitudes are measured, as described in Pustilnik et al. (2017), on the HST images at the epoch of May 2010. We perform the aperture photometry of a subsample of 35 of these fifty supergiants, which are clearly isolated in the HST images of December 2017. The zero point is adopted as a median of all obtained estimates. This statistics is robust, even if some of the used stars experience small brightness variations between the two HST epochs.
To derive correct absolute magnitudes and colours, we need to adopt the realistic value of extinction. For further corrections of the stellar absolute magnitudes and colours in Knot 3, we adopt the value of extinction of E(B − V) = 0.12 and the related AV = 0.36 mag. This value of E(B − V) is substantially larger than the MW extinction in this direction, E(B − V)MW = 0.016 mag according to Schlafly & Finkbeiner (2011). This larger extinction corresponds to the average of the three independent estimates of the internal extinction C(Hβ) in this HII region, as determined from the spectra of Knot 3, obtained in the epochs when the LBV was below the detection limit, as presented in Pustilnik et al. (2005), Annibali et al. (2019b). We suppose that the dust, affecting the relative emission-line fluxes in the HII region, affects as well the total emission of Knot 3 and the emission of all stars in this region. That is, to derive the absolute magnitudes MV, 0 with the account for that extinction, we should use the correction of δ V = −0.36 mag. The related correction of E(V − I) = 0.165 mag.
For the brighter star, we derive the apparent magnitude V = 23.99±0.05 mag and colour (V − I) = 0.056±0.115. The elevated errors of magnitudes for both components of the close ’pair’ (in comparison to the aperture photometry errors) appear due to the additional uncertainties of the component flux estimate in course of the two-Gauss fitting to the 1D photometric profile. The respective absolute V-magnitude MV, 0 = –6.90±0.05 and colour (V−I)0 = –0.109±0.115. So that, this star can be assigned to B supergiant. For LBV (DDO68-V1), we derive the following parameters: V = 25.00±0.12, (V − I) = –0.146±0.34. The respective absolute V-magnitude MV, 0 = –5.89±0.12 and colour (V−I)0 = –0.31±0.34. Taken together with the direct estimate of the LBV light (V = 20.05 mag) at the HST image at the epoch of May 2010 (Pustilnik et al. 2017), and its related MV, 0 = –10.84 mag, this assumes the minimal total amplitude of DDO68-V1 of δ V≳ 5.0 mag.
Since we have for the December 2017 HST data two independent images for each of the filters, we can check possible light variations of DDO68-V1 on the timescales of 2–3 weeks. For the sum of the two stars in the aperture (BSG+LBV), we have variations between the individual images of δ V, δ I of 0.01 mag or less, with the formal error of the individual estimates of 0.0034 mag for V-band and 0.0063 mag - for I-band. Taking this as an upper limit, and accounting for the LBV contribution to the total light of this close ’pair’ of ∼30%, we estimate the respective amplitude of variations of the LBV in this period as δ V≲0.03 mag.
We should comment, why we adopt for the HST images of 2017 the aperture photometry instead of the common PSF photometry with the DOLPHOT package. As already mentioned, the HST images in 2010 and 2017 were obtained with the different instruments, ACS/WFC (Advanced Camera for Surveys) and WFC3/UVIS (Wide Field Camera 3), respectively. We performed PSF photometry for these two epochs, using the DOLPHOT parameters recommended by Annibali et al. (2019b). These authors notice the systematic shifts of 0.03–0.04 mag between the PSF photometry results, corresponding to ASC and WFC3 instruments. However, our photometry with the same DOLPHOT parameters results in the systematical shifts up to 0.10–0.15 mag. We also tried to change DOLPHOT parameters to those recommended in the DOLPHOT manual and to those from paper by Williams et al. (2014). However, this does not help and the above systematics remains. Therefore, to remedy the problem, we decide to adopt as the reference values, the photometry with ACS/WFC in the HST images in 2010. And then, we use the stars with measured magnitudes as the local standards in the images in 2017.
Appendix B: Subtraction of the underlying light of Knot 3 HII region and lightcurve of DDO68-V1
As described above and in the previous works (e.g. Pustilnik et al. 2017), we assume, as the first approximation, that all visible variability of the HII region Knot 3 is due to the (strong) variability of DDO68-V1. To subtract the non-variable light of the underlying HII region, we need to determine the total magnitude of this region within the used aperture (here the circle with radius of 2.5 arcsec). As one can see from the lightcurve of region Knot 3 in Fig. 2 in Pustilnik et al. (2024), this level is fainter than the formal minimum of the lightcurve in V-band of Vmin = 20.20 mag.
To define better the minimal level of the integrated light of Knot 3, in order to use this amount in the analysis of the ground-based photometry and to derive the residual light of the LBV, we use the following approach.
In Table C.1, we present all results of the integrated photometry in B, V and R-bands for the DDO68 star-forming region Knot 3. The presented magnitudes include the upward corrections of the measured light which account for the loss of the light in the fixed-size aperture for different seeings (see Sect. 2.6 in Pustilnik et al. (2024)).
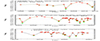 |
Fig. B.1. V-band lightcurves of the LBV DDO68-V1 before, during and after the ’giant eruption’ and the follow-up S Dor type variations with amplitudes of 3.0 to ≳3.5 mag. Green symbols are for the background level of Vback = 20.23 mag, while red symbols are for Vback = 20.24 mag. Top panel. The V-band lightcurve of the LBV on the archive data and during the giant eruption (1988–2016). The direct HST measurements are marked by black lozenges. Middle panel. The V-band lightcurve for the LBV for giant eruption and afterwards (2004–2024). Bottom panel. The same lightcurve for LBV, for the period of 2014–2024, for a more detailed view of the S Dor phase. |
For V-band, we have an advantage of the direct measurement in the HST image at epoch of December 2017 of V magnitudes of both objects in the close optical pair, DDO68-V1 and a blue supergiant neighbour at 0.11 arcsec. Having the total brightness of Knot 3 near the bottom of its registrated lightcurve, at the level of Vtot=20.17–20.19 mag, one can find the self-consistent level of the background light of the HII-region (including the rest stars). At this level, the faintest observed value of VK3, tot = 20.19±0.013, after subtraction of the background, and then of the light of the nearby B supergiant, should give the non-negative signal for LBV. This criterion gives the estimate of Vback = 20.23–20.24 mag.
We adopt for further analysis Vback = 20.23. The respective lightcurves in Fig. B.1 are marked by green symbols, connected by dashed lines. The variant of Vback = 20.24 will slightly shift upwards the majority of DDO68-V1 magnitudes, that will be within their uncertainties. The respective lightcurves are shown by red symbols in the same figures. The largest changes for Vback = 20.24 appear for the bottom of the LBV lightcurve, say for the range of Vtot=20.17–20.19 mag.
The level of Vback = 20.23–20.24 mag is further supported by the light of the LBV, derived directly on the HST images at epoch of December 2017, VLBV = 25.00 mag. This level appears close to several other estimates near the bottom of the LBV lightcurve. If we adopt the background level at the fainter brightness, for example, Vback = 20.25, all the ground-based minima will appear substantially brighter, so that the HST V-magnitude of the LBV becomes the only faintest point in the whole lightcurve. While we can not exclude such a case, this looks less likely than the case of the HST point and of the other minima to be of the comparable brightness.
A part of the earlier (before year 2016) estimates of Knot 3 brightness is published in Pustilnik et al. (2017), where we confirm the event of the LBV giant eruption. The photometry and analysis of those images is updated for this paper. Therefore the magnitudes in our Table C.1 and those in Table 2 from Pustilnik et al. (2017) are slightly different. The main factors that lead to the changes are: 1) a more careful and homogeneously for all dates determined background around Knot 3; 2) the full account for the loss of the light in the aperture with the fixed radius due to the variable seeing.
The resulting magnitudes after the background subtraction are presented in Table C.2. They include both, the V-mag for the sum light of the close pair of LBV and BSG with its error, and V-mag for the pure LBV light, after subtraction of the BSG light from the sum value. The errors for the sum light of the pair are transfered from the errors of V mag of Knot 3 in Table C.1. The errors for V mag of the pure LBV light, in turn, are transfered from the errors of the V mag of the pair.
Appendix C: Colour variations of Knot 3 HII region and implication for DDO68-V1
In Fig. C.1, we present variations of (B − V) and (V − R) colours of Knot 3, corrected for E(B − V) = 0.12, versus its V-magnitude.
We assume, that at first approximation, both, the total magnitudes and colour indices of Knot 3, vary only due to the variable light of the LBV DDO68-V1. Then, the walks of the integrated colours in these plots correspond to the varying contribution of the LBV light to the total light of Knot 3.
If we exclude the brightest phase, corresponding to the ’giant eruption’, the range of V(Knot 3)=19.95 to 20.19 corresponds to V(LBV) of ∼21.7 to ∼25.0 mag, that is the range from maxima to minima of quasi S Dor variations. For (B − V), one can see the clear trend of reddening when the LBV gets brighter and its contribution to the light of the whole Knot 3 (Vback = 20.23) reaches 20–25 %. This type of colour variations is characteristic of the S Dor phase. For example, the (B − V) colour index changed systematically, getting bluer by ∼0.1 mag in the LBV R71 in course of its fading in 1975–1979 by ∼1 mag (Spoon et al. 1994, and the plot (B − V vs V, kindly presented by the referee).
At the same time, (V − R) colour also changes substantially, but gets bluer. While the reddening of LBV along the raising luminosity is consistent with the behaviour of Knot 3 (B − V) index, the variation of (V − R) index looks clearly inconsistent with the cooling ’atmosphere’ of LBV in the course of its expansion. To illustrate this situation, we draw by red solid lines the expected changes of the integrated colours of Knot 3 for the simple model, in which the (B − V) and (V − R) colours of the LBV in this phase vary from late B supergiant to a late F supergiant as the linear function of its brightness.
Thus, it is evident, that near the local maxima the (V − R) colour of Knot 3 tends to become bluer. One of the possibilities of such behaviour, could be the diminishing of contribution of the strong emission line Hα in the spectrum of DDO68-V1 in R-band, what somewhat compensates its reddening in the high state. The other options include the variation of the Hα flux in the related nebulae due to variable ionisation from the DDO68-V1.
Due to the related timescales, one can not connect such a behaviour with, for example, variability of emission Hα in the H II region, since the characteristic time for Hydrogen recombination at Ne∼ 10 cm−3 is of the order of 104 years. In principle, it is possible to examine an option of the compact (fraction of parsec) denser shell as visible around some Milky Way LBVs (with Ne∼ 105 cm−3). If in such a shell, the substantial Hα emission makes (V − R) redder near S-Dor minima (aka blue supergiant), then, the switch-off of the ionisation source in the cooler phases near the maxima, results in the ’fast’ recombination and reducing the contribution of Hα and its effect on (V − R) colour.
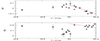 |
Fig. C.1. The colour indices (B − V) (top panel) and (V − R) (bottom panel) of the total Knot 3 light (corrected for E(B − V) = 0.12, see text) versus its brightness in V band for all available photometric data. The total magnitudes VKn.3 of 20.17–20.19 mag correspond to several deep minima on the lightcurve of LBV after the ’giant eruption’. Respectively, the total magnitudes of Knot 3 of VKn.3∼19.96–20.03 mag correspond to the maxima of the LBV lightcurve in this period. The solid red lines, overplotted to the both panels, represent the expected changes of Knot 3 colour in the case if the (B − V) and (V − R) colours of the LBV change as a linear function of V(LBV) between quasi S-Dor minimum and maximum. The extremes correspond to an early B (as its (V − I) from the HST data at the epoch of December 2017, with V = 25.0 mag) and to late F near the local maxima, when V(LBV) ∼22.0 mag. |
B, V, R total magnitude estimates for DDO68 SF region Knot 3 adopted from Pustilnik et al. (2024)
V-band magnitudes for the sum of LBV and the close B-supergiant (denoted as B+LBV), and for the pure LBV, after subtracting the B-supergiant light (V=23.99) from the sum. Adopted background: Vback=20.23 mag.
All Tables
B, V, R total magnitude estimates for DDO68 SF region Knot 3 adopted from Pustilnik et al. (2024)
V-band magnitudes for the sum of LBV and the close B-supergiant (denoted as B+LBV), and for the pure LBV, after subtracting the B-supergiant light (V=23.99) from the sum. Adopted background: Vback=20.23 mag.
All Figures
|
Fig. A.1. Part of the HST image of DDO68 in F606W filter, centred on the SF region Knot 3 with the LBV DDO68-V1 near its centre. The aperture, used for the ground-based photometry, is superimposed as a cycle with Daper= 5″. Arrows show directions to the north and east. Top panel: Epoch of May 2010 (Program ID 11578, PI: A.Aloisi). Bottom panel: Epoch of December 2017 (Program ID 14716, PI: F.Annibali). The shown rectangular with width of 7 pixels (0.28 arcsec) is extracted and its light is summed-up along Y direction to perform 1D two-Gauss fitting of DDO68-V1 region. See details in Appendix A. |
| In the text | |
|
Fig. A.2. Top panel: 1D scan of brightness in V-band near DDO68-V1 on the epoch of May 2010. Bottom panel: Same as in the left-hand panel, but for the epoch of December 2017. Red solid line shows the level of the underlying background, above which the two-Gauss fitting was performed, as shown in the left panel of Fig. A.3. |
| In the text | |
|
Fig. A.3. Left-hand panel: Two-Gauss fitting to the V-band brightness profile near the position of DDO68-V1 for the epoch of December 2017. Right-hand panel: Residual signal of the accepted two-Gauss fitting. See parameters of the components in the text. |
| In the text | |
|
Fig. B.1. V-band lightcurves of the LBV DDO68-V1 before, during and after the ’giant eruption’ and the follow-up S Dor type variations with amplitudes of 3.0 to ≳3.5 mag. Green symbols are for the background level of Vback = 20.23 mag, while red symbols are for Vback = 20.24 mag. Top panel. The V-band lightcurve of the LBV on the archive data and during the giant eruption (1988–2016). The direct HST measurements are marked by black lozenges. Middle panel. The V-band lightcurve for the LBV for giant eruption and afterwards (2004–2024). Bottom panel. The same lightcurve for LBV, for the period of 2014–2024, for a more detailed view of the S Dor phase. |
| In the text | |
|
Fig. C.1. The colour indices (B − V) (top panel) and (V − R) (bottom panel) of the total Knot 3 light (corrected for E(B − V) = 0.12, see text) versus its brightness in V band for all available photometric data. The total magnitudes VKn.3 of 20.17–20.19 mag correspond to several deep minima on the lightcurve of LBV after the ’giant eruption’. Respectively, the total magnitudes of Knot 3 of VKn.3∼19.96–20.03 mag correspond to the maxima of the LBV lightcurve in this period. The solid red lines, overplotted to the both panels, represent the expected changes of Knot 3 colour in the case if the (B − V) and (V − R) colours of the LBV change as a linear function of V(LBV) between quasi S-Dor minimum and maximum. The extremes correspond to an early B (as its (V − I) from the HST data at the epoch of December 2017, with V = 25.0 mag) and to late F near the local maxima, when V(LBV) ∼22.0 mag. |
| In the text | |
Current usage metrics show cumulative count of Article Views (full-text article views including HTML views, PDF and ePub downloads, according to the available data) and Abstracts Views on Vision4Press platform.
Data correspond to usage on the plateform after 2015. The current usage metrics is available 48-96 hours after online publication and is updated daily on week days.
Initial download of the metrics may take a while.