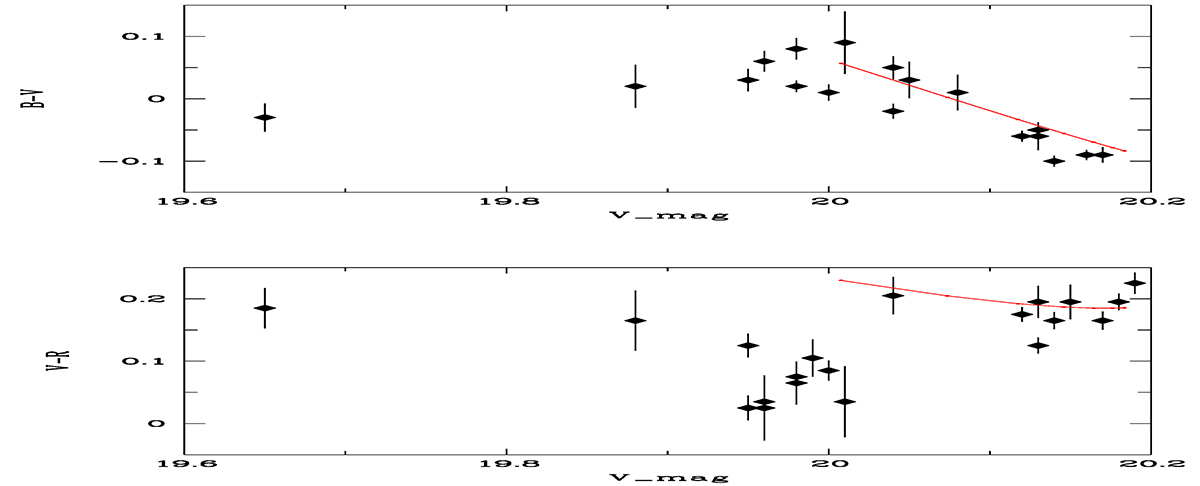
Fig. C.1.
Download original image
The colour indices (B − V) (top panel) and (V − R) (bottom panel) of the total Knot 3 light (corrected for E(B − V) = 0.12, see text) versus its brightness in V band for all available photometric data. The total magnitudes VKn.3 of 20.17–20.19 mag correspond to several deep minima on the lightcurve of LBV after the ’giant eruption’. Respectively, the total magnitudes of Knot 3 of VKn.3∼19.96–20.03 mag correspond to the maxima of the LBV lightcurve in this period. The solid red lines, overplotted to the both panels, represent the expected changes of Knot 3 colour in the case if the (B − V) and (V − R) colours of the LBV change as a linear function of V(LBV) between quasi S-Dor minimum and maximum. The extremes correspond to an early B (as its (V − I) from the HST data at the epoch of December 2017, with V = 25.0 mag) and to late F near the local maxima, when V(LBV) ∼22.0 mag.
Current usage metrics show cumulative count of Article Views (full-text article views including HTML views, PDF and ePub downloads, according to the available data) and Abstracts Views on Vision4Press platform.
Data correspond to usage on the plateform after 2015. The current usage metrics is available 48-96 hours after online publication and is updated daily on week days.
Initial download of the metrics may take a while.