Fig. B.1.
Download original image
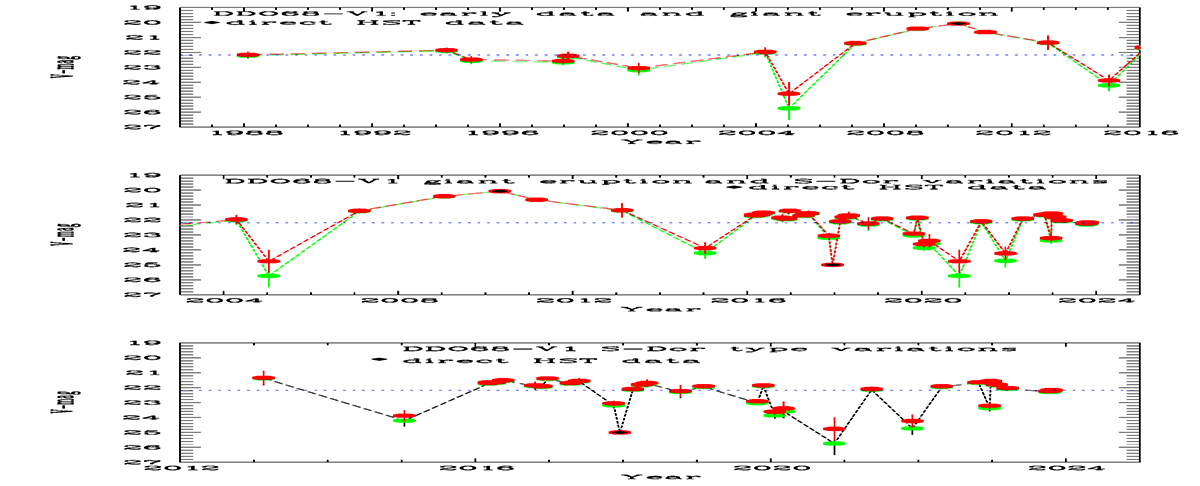
V-band lightcurves of the LBV DDO68-V1 before, during and after the ’giant eruption’ and the follow-up S Dor type variations with amplitudes of 3.0 to ≳3.5 mag. Green symbols are for the background level of Vback = 20.23 mag, while red symbols are for Vback = 20.24 mag. Top panel. The V-band lightcurve of the LBV on the archive data and during the giant eruption (1988–2016). The direct HST measurements are marked by black lozenges. Middle panel. The V-band lightcurve for the LBV for giant eruption and afterwards (2004–2024). Bottom panel. The same lightcurve for LBV, for the period of 2014–2024, for a more detailed view of the S Dor phase.
Current usage metrics show cumulative count of Article Views (full-text article views including HTML views, PDF and ePub downloads, according to the available data) and Abstracts Views on Vision4Press platform.
Data correspond to usage on the plateform after 2015. The current usage metrics is available 48-96 hours after online publication and is updated daily on week days.
Initial download of the metrics may take a while.