Open Access
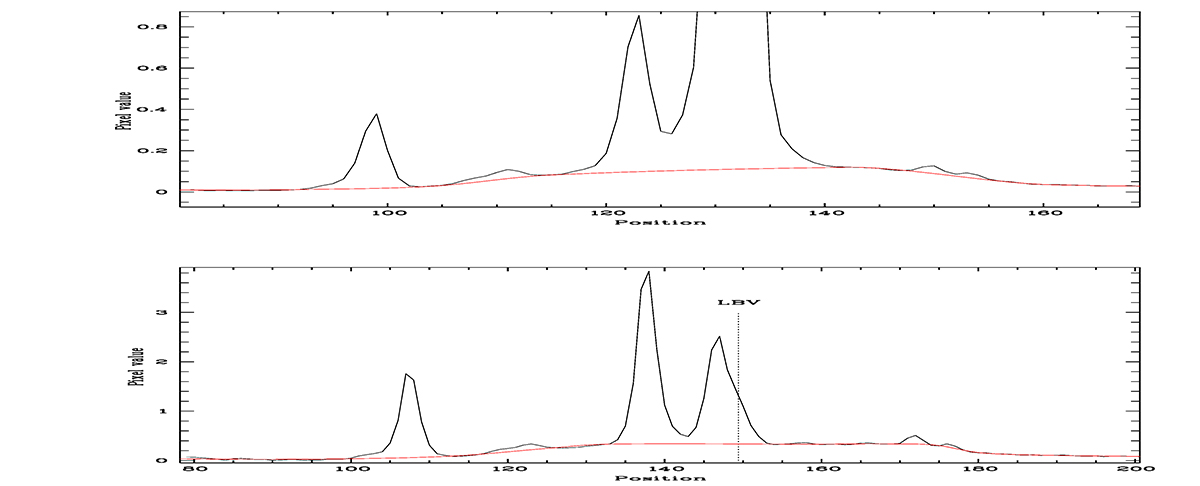
Fig. A.2.
Download original image
Top panel: 1D scan of brightness in V-band near DDO68-V1 on the epoch of May 2010. Bottom panel: Same as in the left-hand panel, but for the epoch of December 2017. Red solid line shows the level of the underlying background, above which the two-Gauss fitting was performed, as shown in the left panel of Fig. A.3.
Current usage metrics show cumulative count of Article Views (full-text article views including HTML views, PDF and ePub downloads, according to the available data) and Abstracts Views on Vision4Press platform.
Data correspond to usage on the plateform after 2015. The current usage metrics is available 48-96 hours after online publication and is updated daily on week days.
Initial download of the metrics may take a while.