Fig. 3.
Download original image
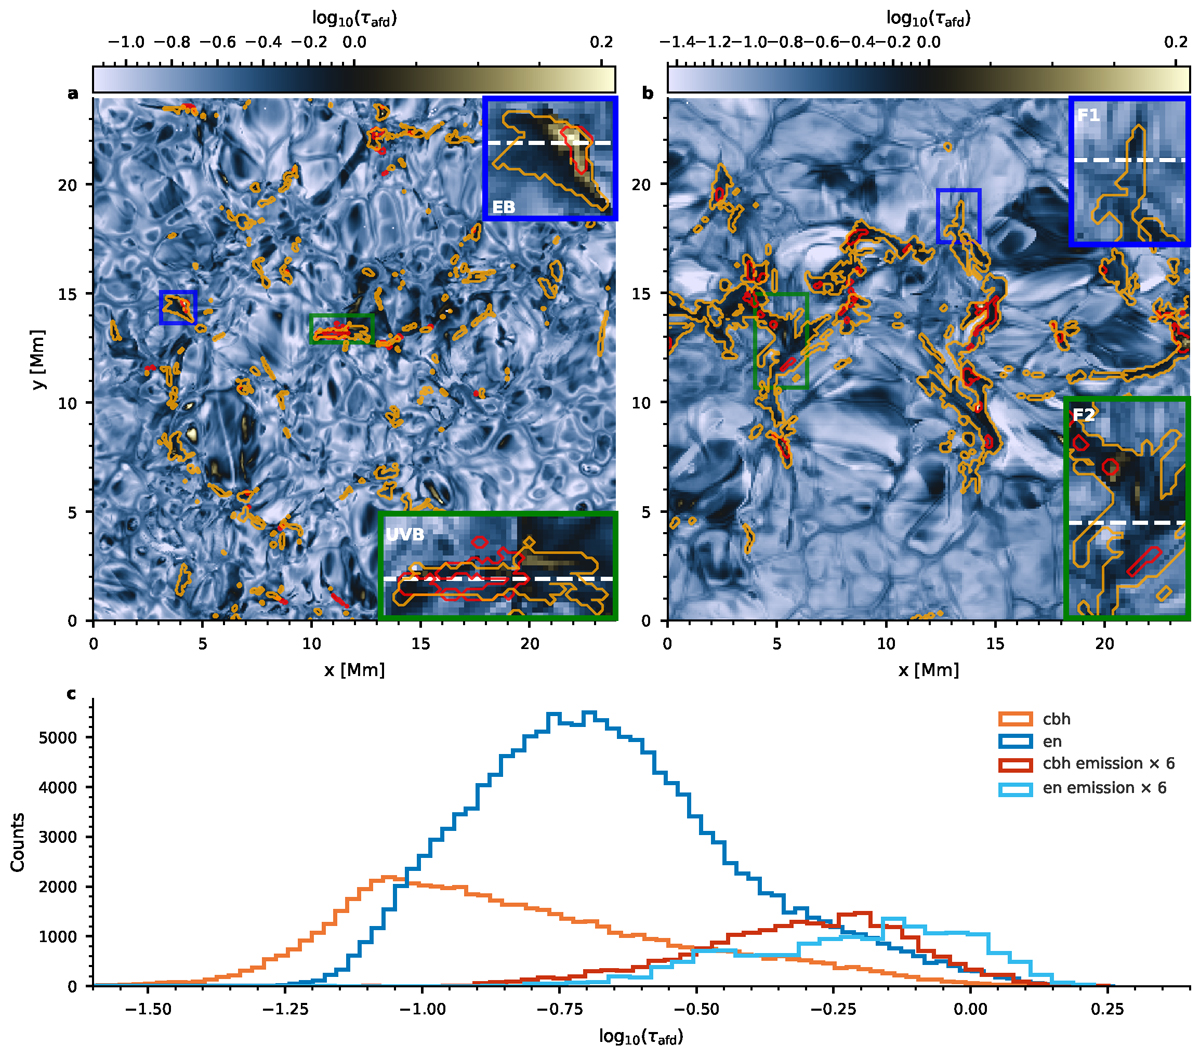
Average formation depth, τafd, for the Hε spectral line. Top panels:τafd maps for the en simulation (panel a) and chb simulation (panel b). The orange contours indicate regions where Hε is strongly in emission, while the red contours indicate regions where Hα shows the typical signature of Ellerman bombs. For each panel, two inserts show a zoomed-in view covering the energetic events labeled earlier: an Ellerman bomb (EB), a UV burst (UVB), and two small flares (F1 and F2). The dashed white lines in the insets indicate the horizontal slices taken for the spectrograms of Figs. 1 and 2. Panel c: Distributions of log10τafd. The emission distribution is amplified by a factor of six.
Current usage metrics show cumulative count of Article Views (full-text article views including HTML views, PDF and ePub downloads, according to the available data) and Abstracts Views on Vision4Press platform.
Data correspond to usage on the plateform after 2015. The current usage metrics is available 48-96 hours after online publication and is updated daily on week days.
Initial download of the metrics may take a while.