Fig. 1.
Download original image
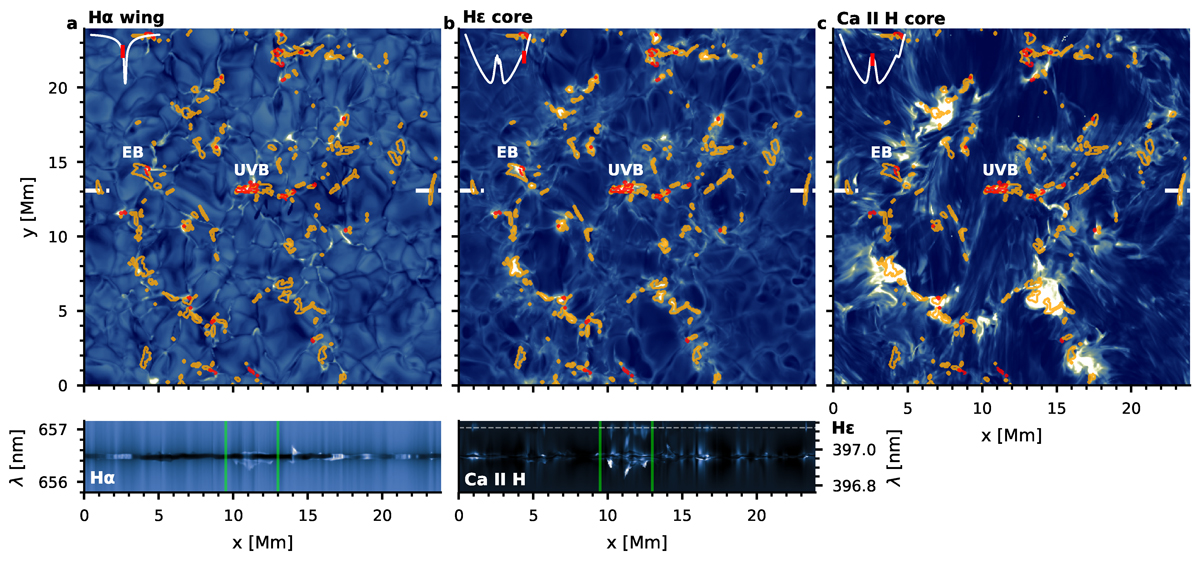
Synthetic observables from the en simulation. The top three panels show images at the fixed wavelengths in the Hα wing, Hε core, and Ca II H core, respectively. The bottom two panels show spectrograms normalized to the continuum taken from a horizontal slice in the simulation at y ≈ 13 Mm (edges denoted by the white lines in the top panels), in Hα and Ca II H (which also includes Hε, whose location is indicated by the dashed gray line). The orange contours in the top panels indicate regions where Hε is strongly in emission, while the red contours indicate regions where Hα shows the typical signature of Ellerman bombs. The UVB and EB labels indicate the location of a UV burst and an Ellerman bomb selected for detailed study. The green vertical lines in the bottom panels indicate the approximate extent of the UV burst.
Current usage metrics show cumulative count of Article Views (full-text article views including HTML views, PDF and ePub downloads, according to the available data) and Abstracts Views on Vision4Press platform.
Data correspond to usage on the plateform after 2015. The current usage metrics is available 48-96 hours after online publication and is updated daily on week days.
Initial download of the metrics may take a while.