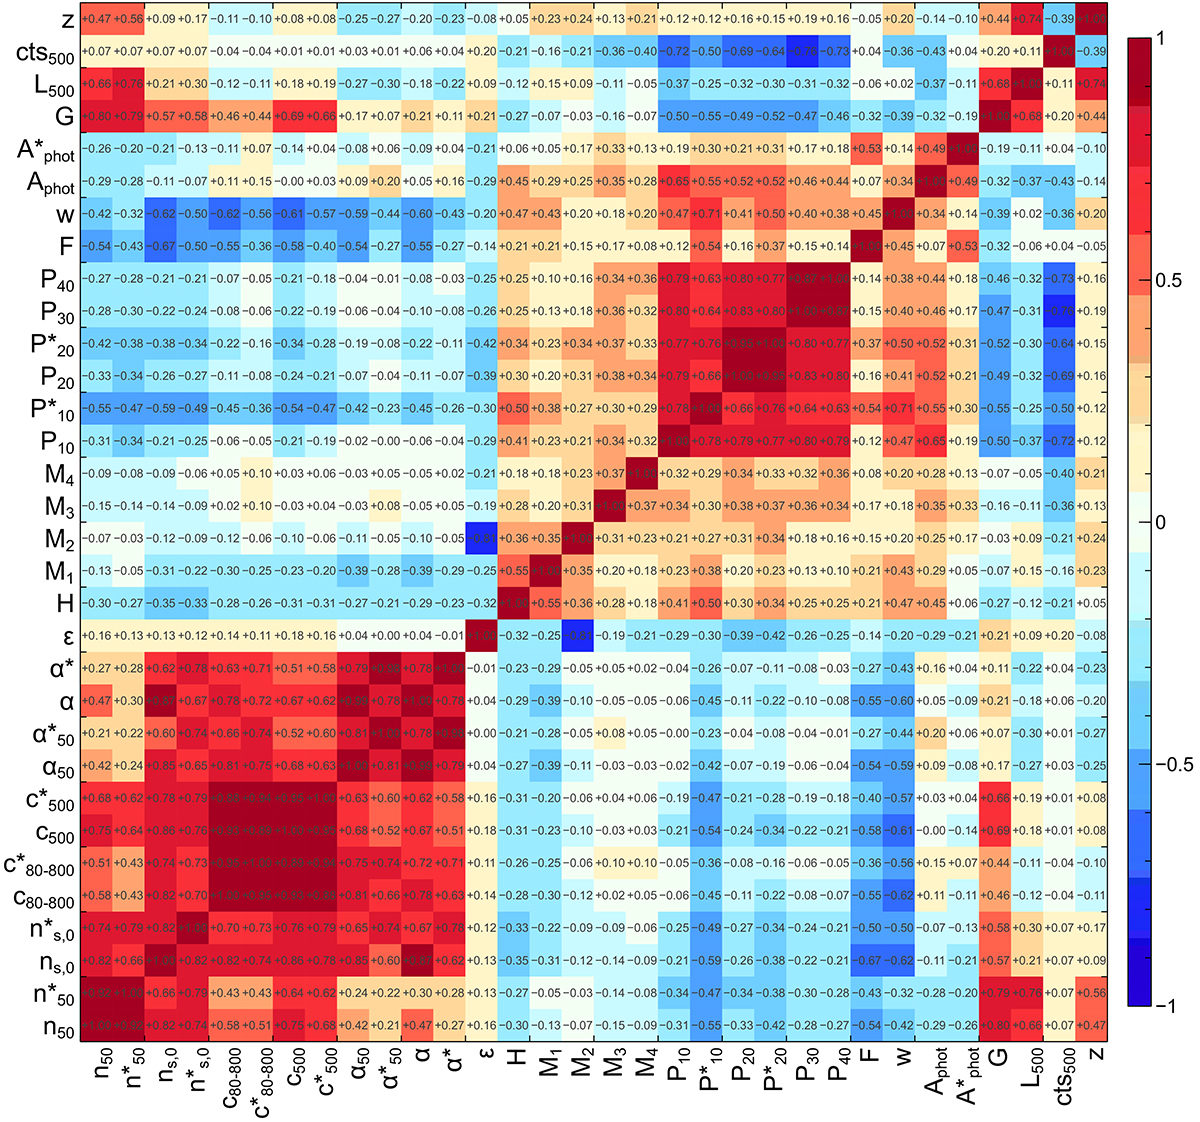
Fig. 8.
Download original image
Correlation matrix between different parameters for the bright cluster subset. Values were measured for clusters with more than 300 counts to reduce the effect of the statistical errors. Log values were taken for the photon asymmetry, power ratios and centroid shift. We also show the correlation with log cluster luminosity (L500), log number of counts in R500 (cts500), and log redshift.
Current usage metrics show cumulative count of Article Views (full-text article views including HTML views, PDF and ePub downloads, according to the available data) and Abstracts Views on Vision4Press platform.
Data correspond to usage on the plateform after 2015. The current usage metrics is available 48-96 hours after online publication and is updated daily on week days.
Initial download of the metrics may take a while.