Open Access
Fig. 7.
Download original image
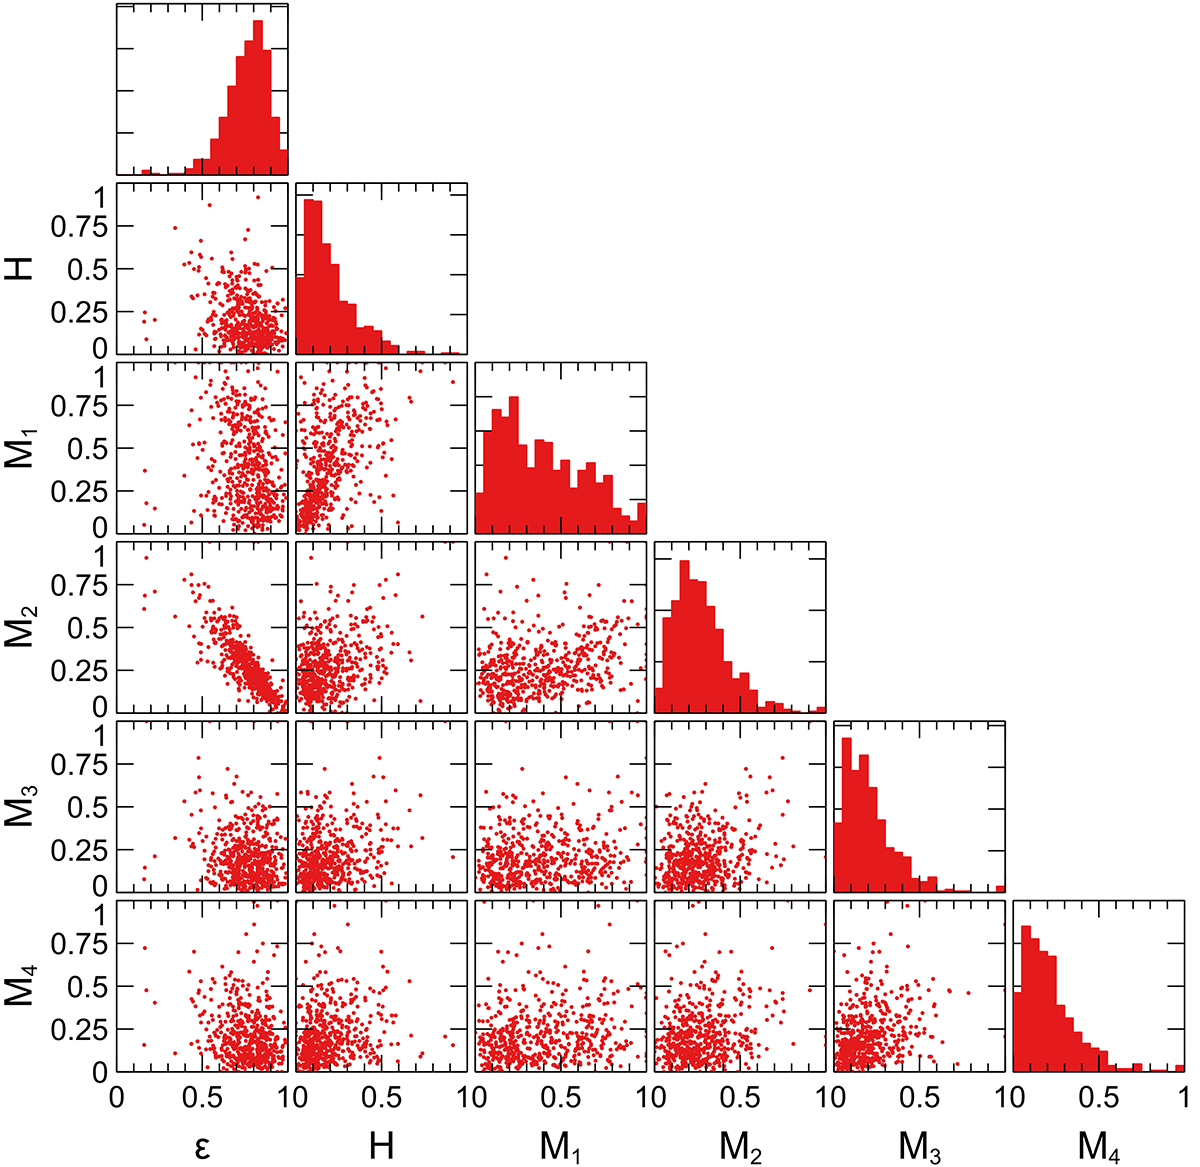
Corner plot of the median MBProj2D shape parameters for the bright cluster (≥300 count) subset. The quantities are plotted against each other, while the rightmost panels show the probability density distribution of each value.
Current usage metrics show cumulative count of Article Views (full-text article views including HTML views, PDF and ePub downloads, according to the available data) and Abstracts Views on Vision4Press platform.
Data correspond to usage on the plateform after 2015. The current usage metrics is available 48-96 hours after online publication and is updated daily on week days.
Initial download of the metrics may take a while.