Open Access
Fig. 23.
Download original image
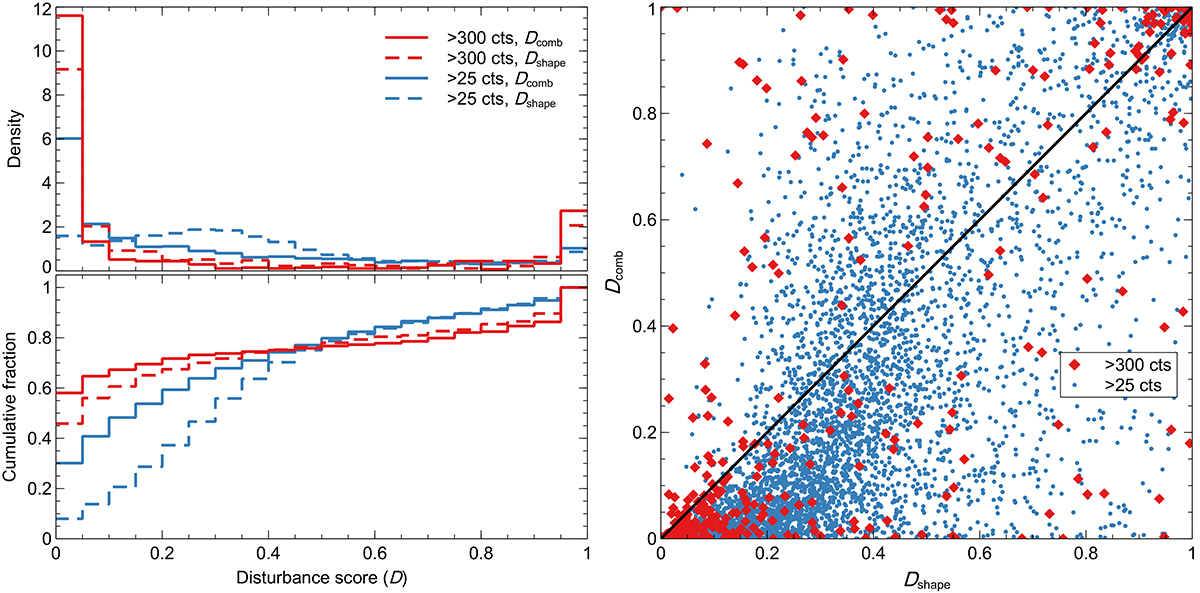
Disturbance scores for the sample for clusters with greater than 25 and greater than 300 counts. Left: Histograms of the distributions of Dcomb (including concentration) and the purely 2D shape based Dshape. Right: Dcomb plotted against Dshape for the two count thresholds.
Current usage metrics show cumulative count of Article Views (full-text article views including HTML views, PDF and ePub downloads, according to the available data) and Abstracts Views on Vision4Press platform.
Data correspond to usage on the plateform after 2015. The current usage metrics is available 48-96 hours after online publication and is updated daily on week days.
Initial download of the metrics may take a while.