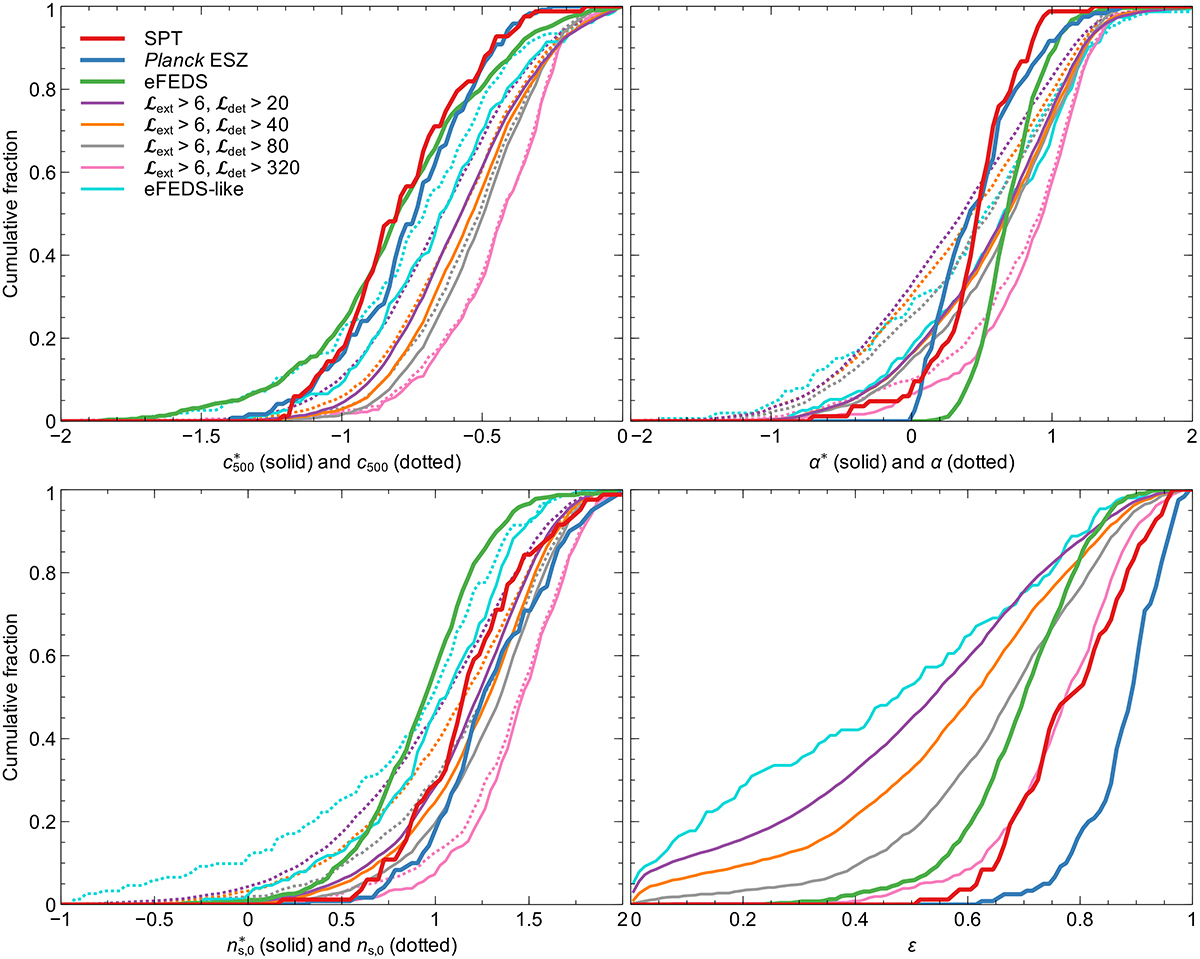
Fig. 21.
Download original image
Cumulative distribution of parameters for SPT, Planck ESZ, and eFEDS clusters compared to eRASS1 for different detection thresholds. For eROSITA the solid lines show the values fixing the cluster position at the peak, while the dotted lines show the distribution for when the cluster position varies during the fit. Shown are the concentration (top left), cuspiness (top right), central scaled density (bottom left), and ellipticity (bottom right). Planck values are taken from Lovisari et al. (2017) and eFEDS values are obtained by Ghirardini et al. (2022). The eFEDS-like curves are for eRASS1 clusters with ℒdet > 5, ℒext > 6 and an exposure time between 1000 and 1400s, to match eFEDS. The median published log masses of the SPT, Planck and eFEDS samples are 14.7, 14.8, and 14.0, respectively. The eROSITA sample median log M⊙ masses are 14.4, 14.5, 14.6, and 14.8, for detection likelihood thresholds of 20, 40, 80, and 320, respectively.
Current usage metrics show cumulative count of Article Views (full-text article views including HTML views, PDF and ePub downloads, according to the available data) and Abstracts Views on Vision4Press platform.
Data correspond to usage on the plateform after 2015. The current usage metrics is available 48-96 hours after online publication and is updated daily on week days.
Initial download of the metrics may take a while.