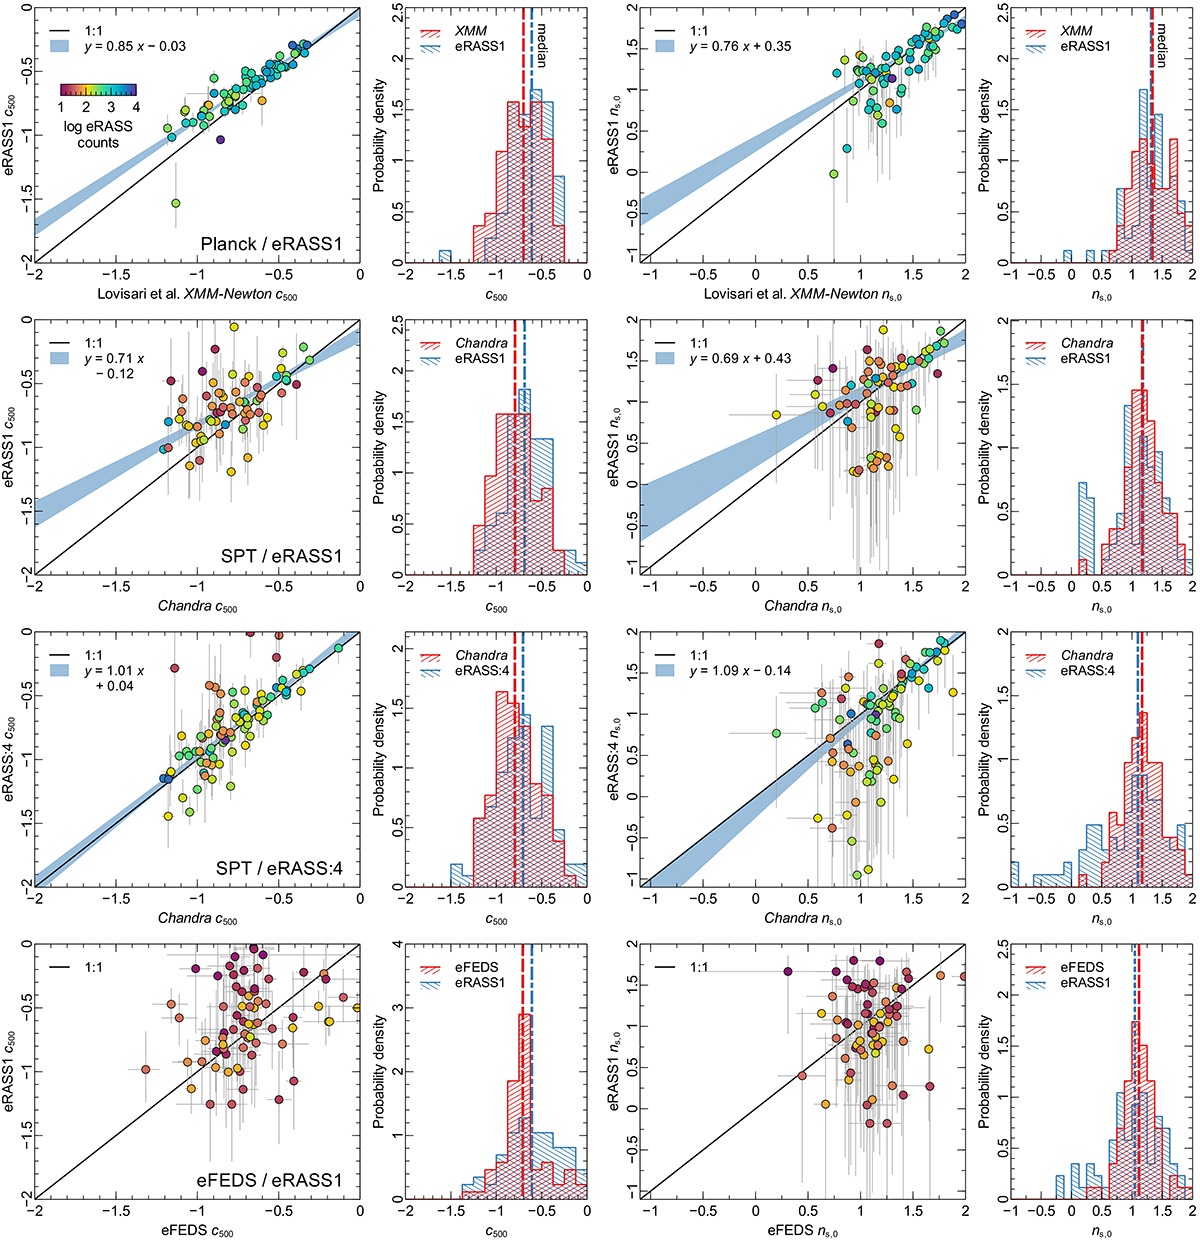
Fig. 20.
Download original image
Comparison of concentration and scaled central density measurements for the same cluster samples between eRASS and other measurements. The two left columns compare c500 and its distributions, while the two right columns show ns, 0. Median values are plotted as vertical lines. The number of counts for the cluster in the eRASS1 or eRASS:4 data is indicated by the colour. Top row: 66 Planck ESZ and eRASS1-detected clusters, with XMM-Newton results from Lovisari et al. (2017) and using the eRASS1 peak values. Second row: 66 SPT and eRASS1-detected clusters, analysed using Chandra data and taking the peak values from eRASS1. Third row: 83 SPT-detected clusters, extracting the values from Chandra eRASS:4 data using similar analysis procedures. Bottom row: 69 clusters detected in both eFEDS and eRASS1. The eFEDS survey results are from Ghirardini et al. (2022), while the eRASS1 results are the best fit position values. For the top three rows, we compute the best fitting linear relation between the results, assuming a normal distribution around the relation.
Current usage metrics show cumulative count of Article Views (full-text article views including HTML views, PDF and ePub downloads, according to the available data) and Abstracts Views on Vision4Press platform.
Data correspond to usage on the plateform after 2015. The current usage metrics is available 48-96 hours after online publication and is updated daily on week days.
Initial download of the metrics may take a while.