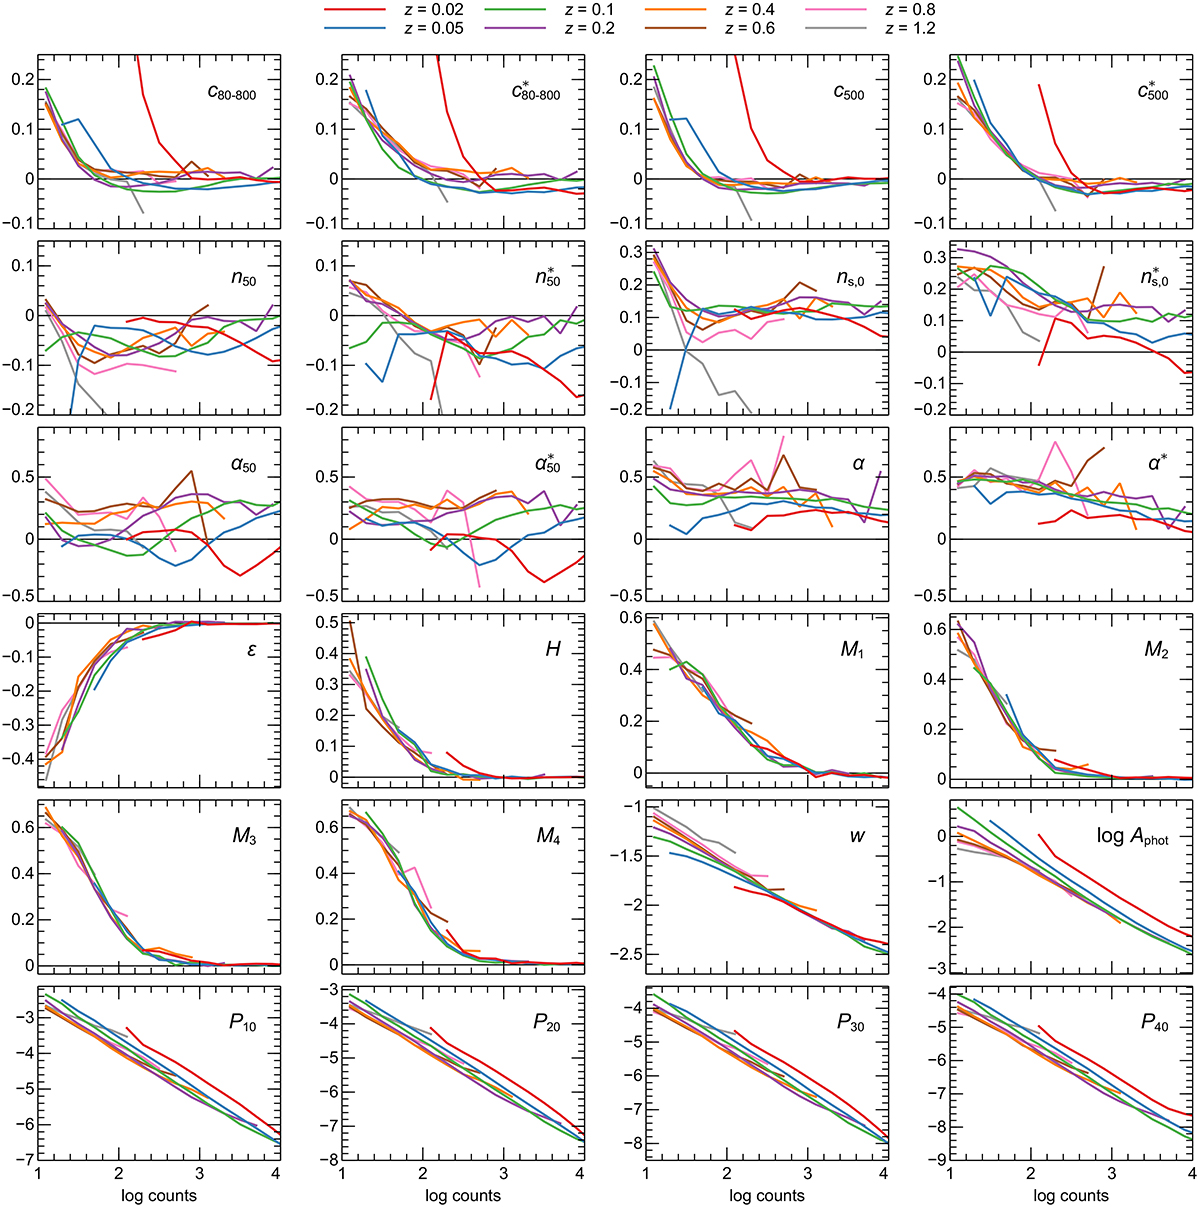
Fig. 18.
Download original image
Recovered parameter bias from simulated clusters as a function of the redshift and number of counts inside an 800 kpc radius circle. For the concentration, central density and cuspiness, shown is the difference between the recovered values and the input profile, after deprojecting the emissivity profile. For the shape parameters, ϵ, H and M1 to M4, we show the difference between the recovered and input values (0.7 for ϵ and 0.3 for the others), for simulations with non-spherical clusters. For the parameters w, Aphot and P10 to P40, we show the value for a spherical cluster.
Current usage metrics show cumulative count of Article Views (full-text article views including HTML views, PDF and ePub downloads, according to the available data) and Abstracts Views on Vision4Press platform.
Data correspond to usage on the plateform after 2015. The current usage metrics is available 48-96 hours after online publication and is updated daily on week days.
Initial download of the metrics may take a while.