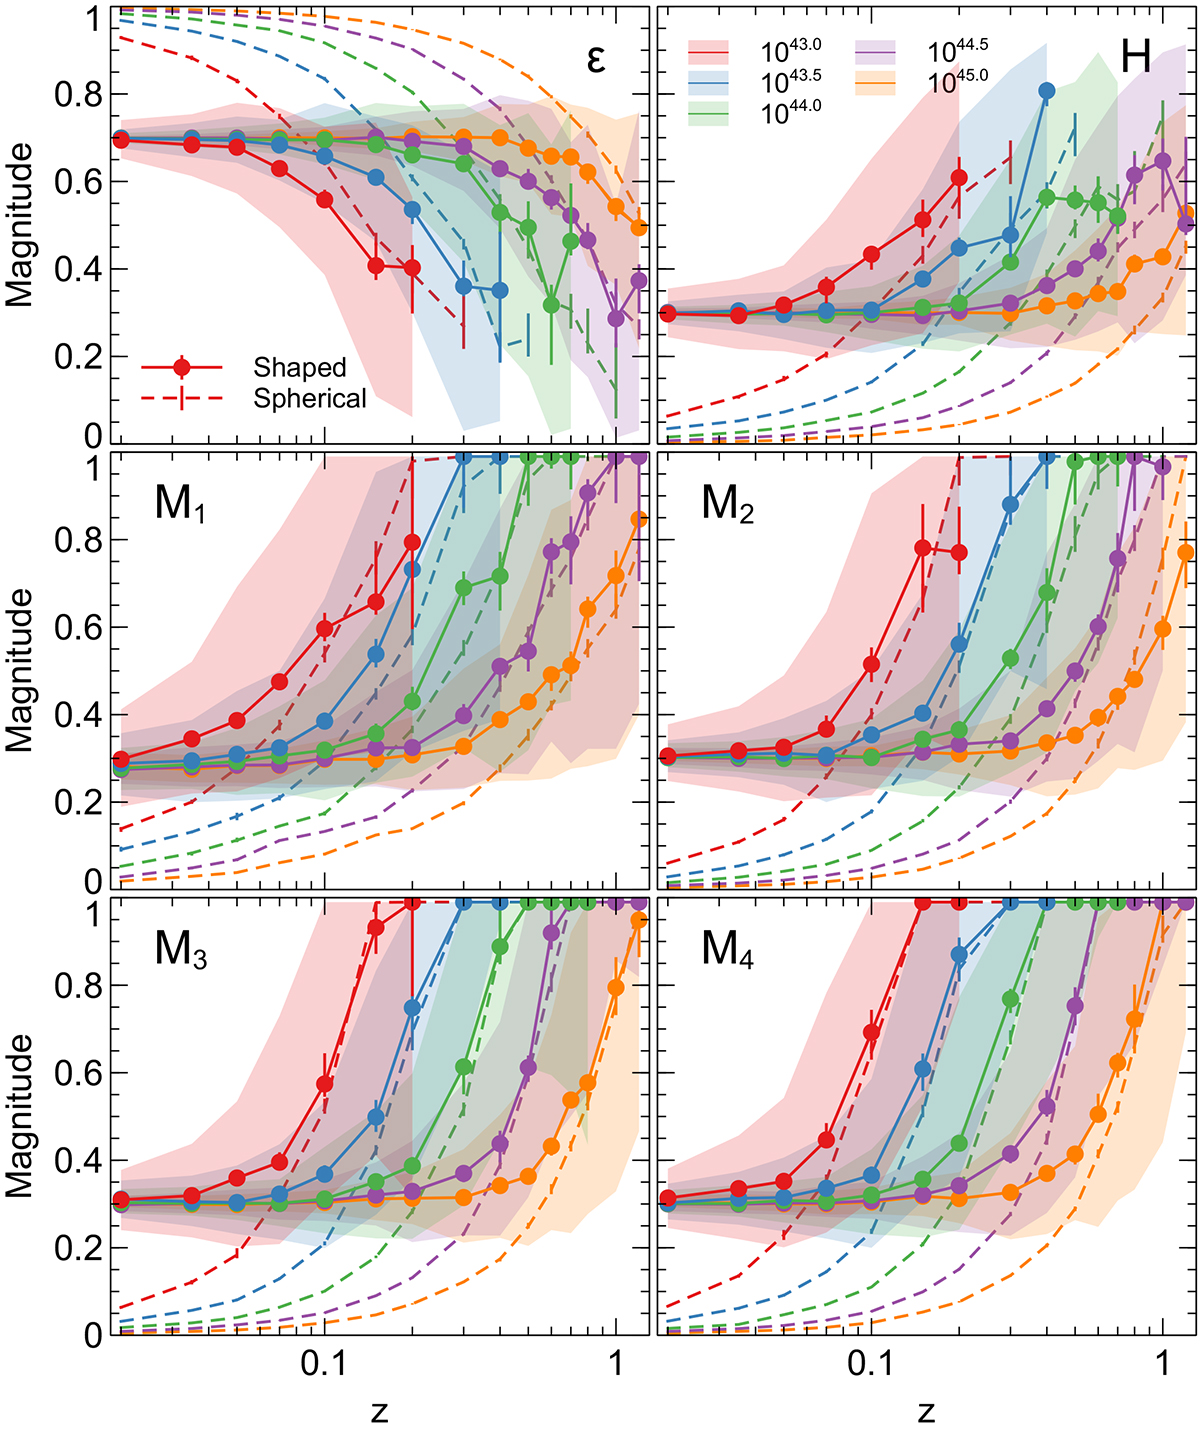
Fig. 15.
Download original image
Recovery of forward modelled parameters as a function of redshift and luminosity using maximum likelihood. The plots show the recovered parameter values as a function of redshift, for clusters with an input shape compared to an input spherical cluster. The error bar shows the average best fitting parameter and the uncertainty on the mean. The shaded region shows the 1σ range of the recovered best fitting parameters. The panels show shaped models with ϵ = 0.7, H = 0.3, M1 = 0.3, M2 = 0.3, M3 = 0.3, and M4 = 0.3, respectively, compared to the spherical models.
Current usage metrics show cumulative count of Article Views (full-text article views including HTML views, PDF and ePub downloads, according to the available data) and Abstracts Views on Vision4Press platform.
Data correspond to usage on the plateform after 2015. The current usage metrics is available 48-96 hours after online publication and is updated daily on week days.
Initial download of the metrics may take a while.