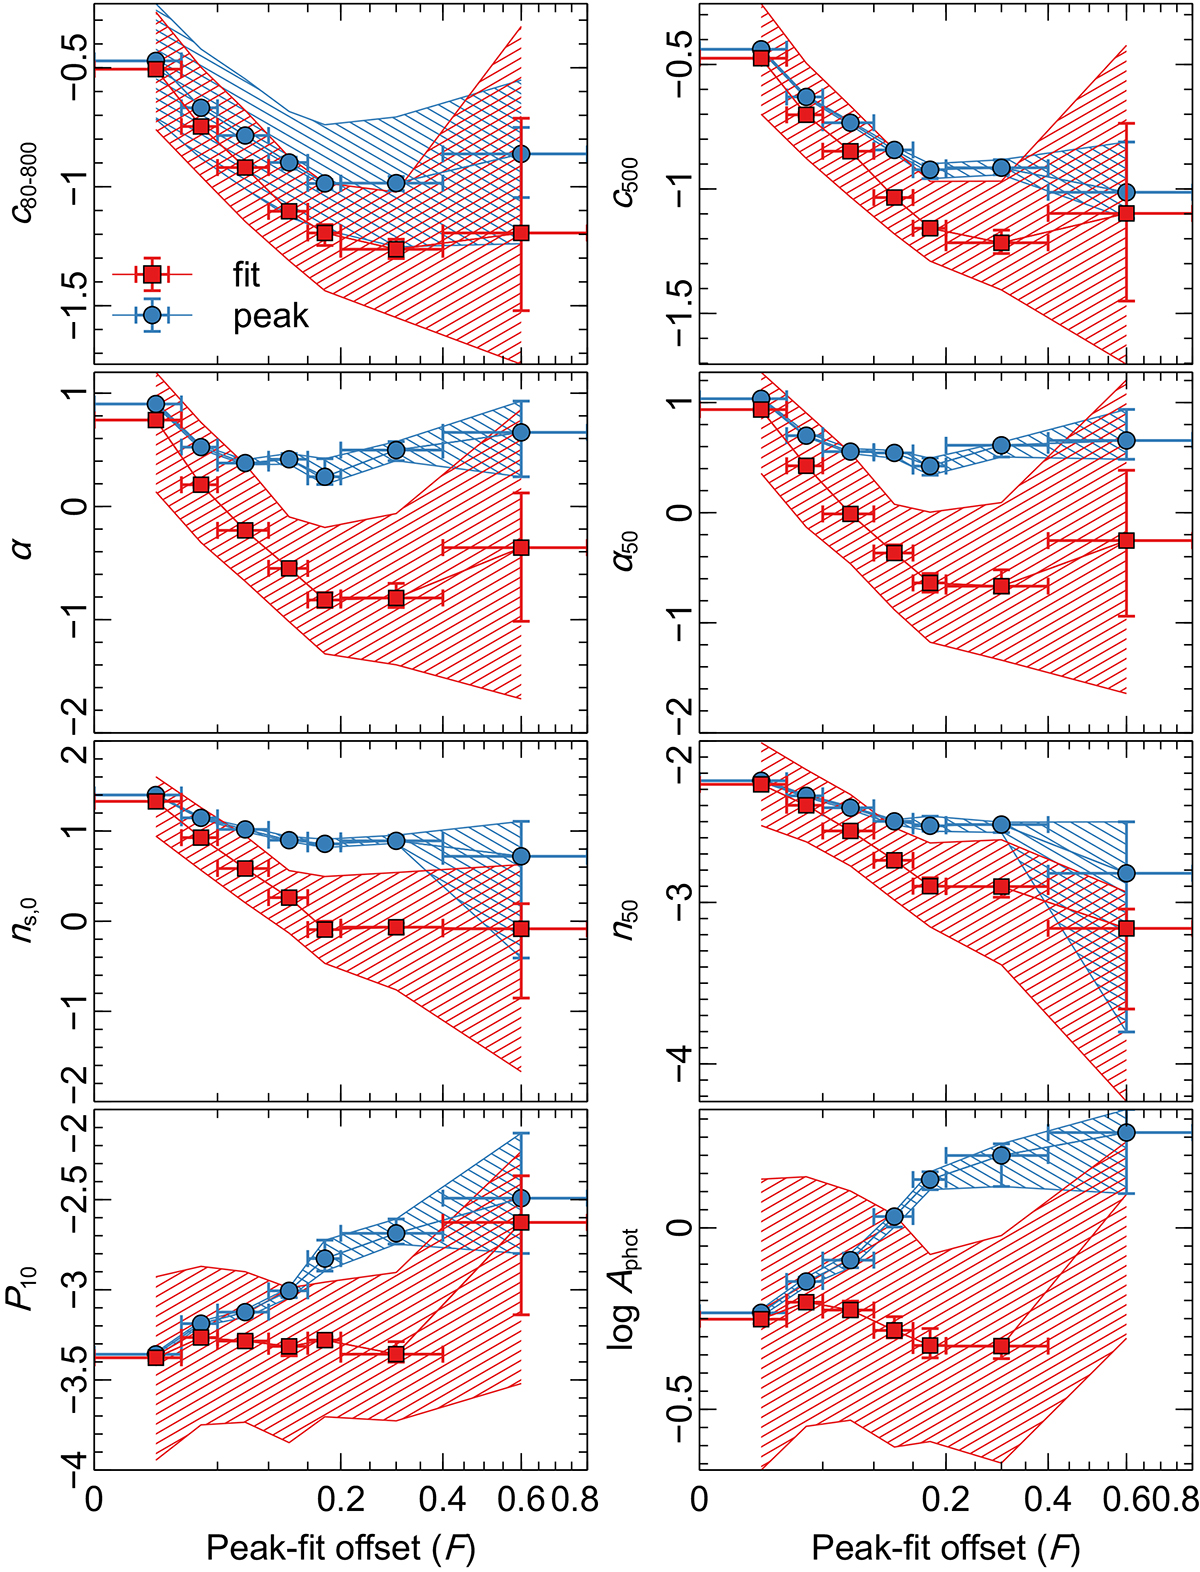
Fig. 14.
Download original image
Fit-centred and peak-centred (∗) quantities as a function of the distance between the cluster peak and the best fit position for a cluster subsample with ℒext > 6 and ℒdet > 20. The median quantities in bins of F are shown with bootstrap resampling uncertainties. The shaded regions show the 1σ percentile width of the data points within each bin.
Current usage metrics show cumulative count of Article Views (full-text article views including HTML views, PDF and ePub downloads, according to the available data) and Abstracts Views on Vision4Press platform.
Data correspond to usage on the plateform after 2015. The current usage metrics is available 48-96 hours after online publication and is updated daily on week days.
Initial download of the metrics may take a while.