Fig. 12.
Download original image
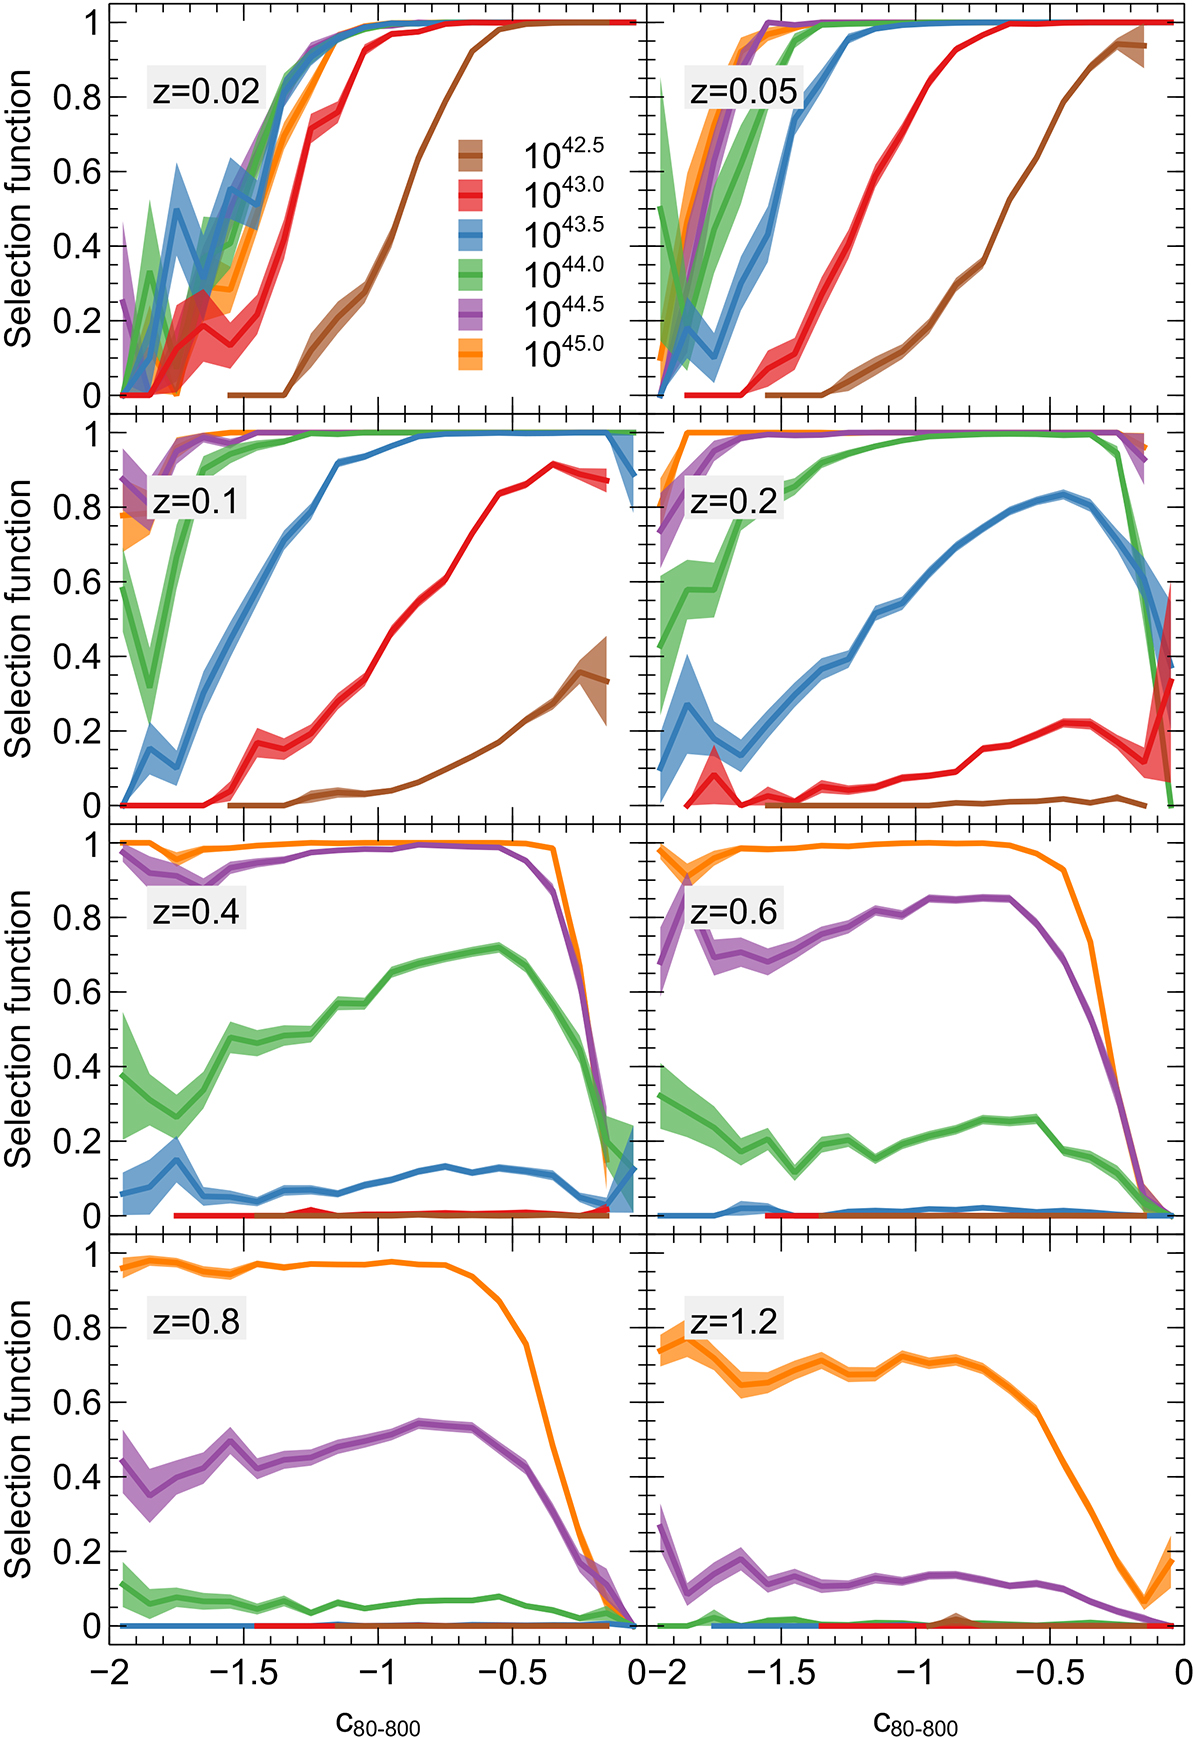
Selection function of clusters with different redshifts and luminosities as a function of concentration that were calculated from simulated observations of spherical clusters. The panels show the detected fraction of clusters at different redshift. For each redshift, we show the detection fraction as a function of concentration for different luminosities (erg s−1). The log concentration (c80 − 800) is computed from the input model profile and is binned into bins of 0.1 width.
Current usage metrics show cumulative count of Article Views (full-text article views including HTML views, PDF and ePub downloads, according to the available data) and Abstracts Views on Vision4Press platform.
Data correspond to usage on the plateform after 2015. The current usage metrics is available 48-96 hours after online publication and is updated daily on week days.
Initial download of the metrics may take a while.