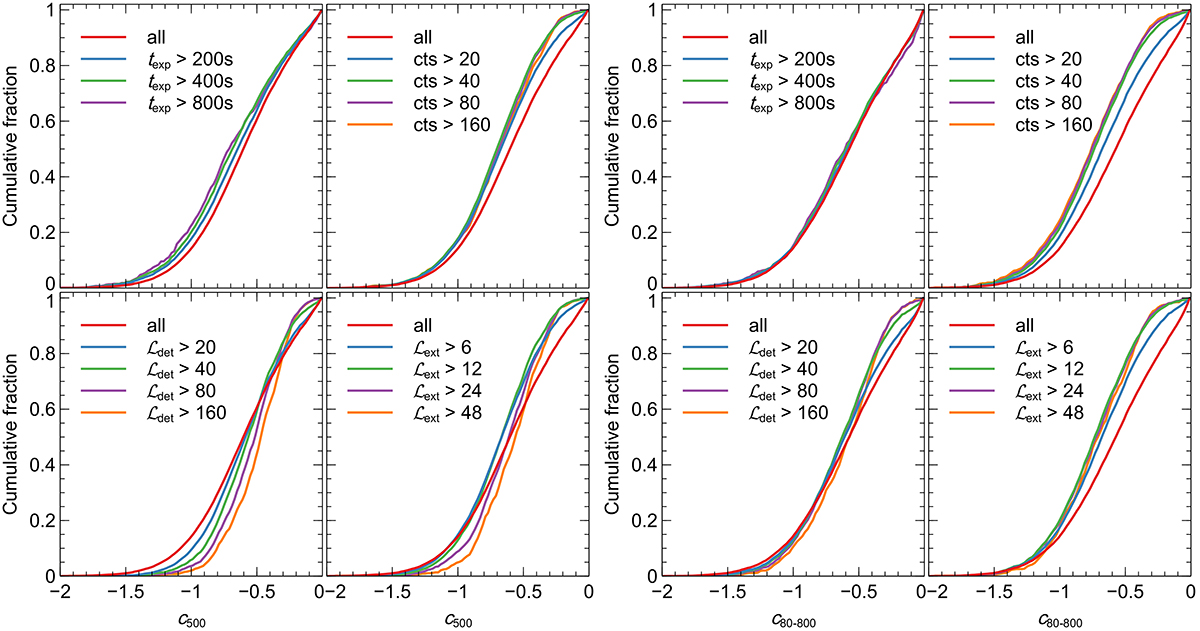
Fig. 11.
Download original image
Cumulative distribution of concentration for different subsamples of the eRASS1 catalogue. The cumulative distributions are shown as a function of exposure time (texp), number of counts in a 800 kpc aperture, detection likelihood (ℒdet), and extension likelihood (ℒext). The left panels show the distribution of c500, while the right panels show the distribution of c80 − 800.
Current usage metrics show cumulative count of Article Views (full-text article views including HTML views, PDF and ePub downloads, according to the available data) and Abstracts Views on Vision4Press platform.
Data correspond to usage on the plateform after 2015. The current usage metrics is available 48-96 hours after online publication and is updated daily on week days.
Initial download of the metrics may take a while.