Open Access
Fig. 4.
Download original image
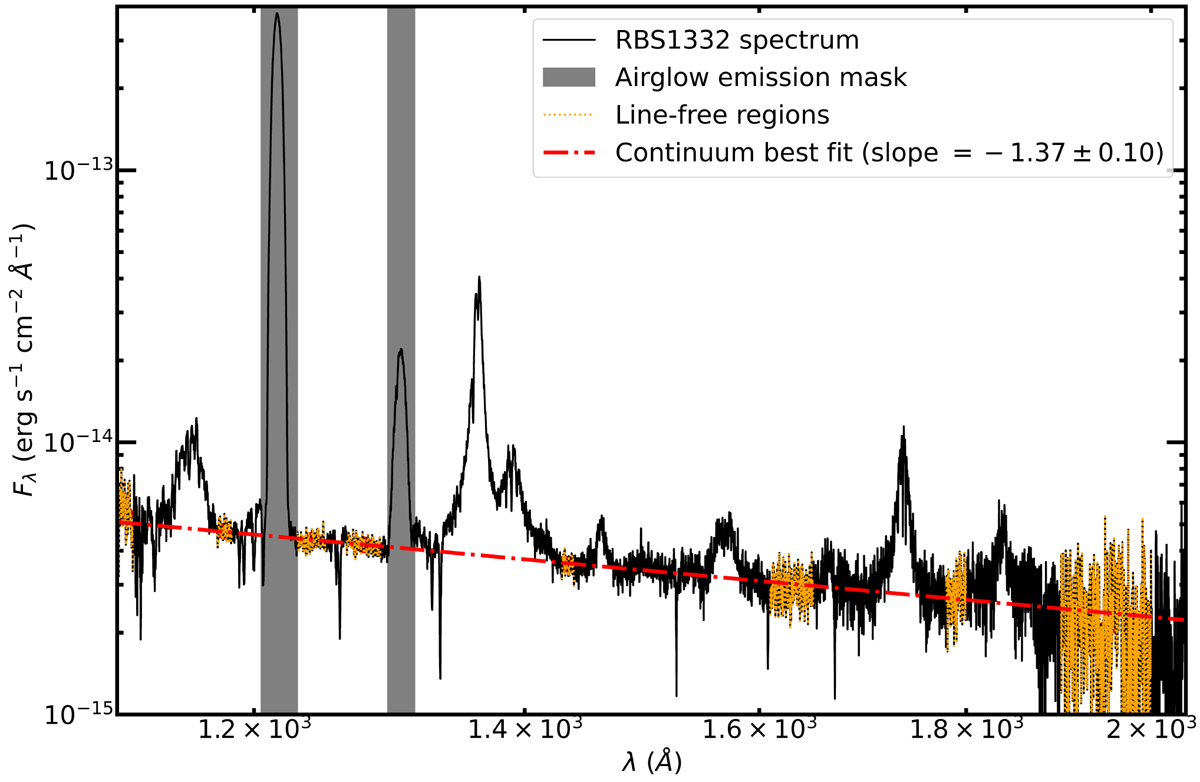
HST spectrum of RBS 1332 (solid black line). The continuum emission (dash-dotted red line) fitted over intervals free of major emission and absorption features (dotted yellow lines) is indicated, along with the masks (grey bands) superimposed on the emission of the UV airglow lines.
Current usage metrics show cumulative count of Article Views (full-text article views including HTML views, PDF and ePub downloads, according to the available data) and Abstracts Views on Vision4Press platform.
Data correspond to usage on the plateform after 2015. The current usage metrics is available 48-96 hours after online publication and is updated daily on week days.
Initial download of the metrics may take a while.