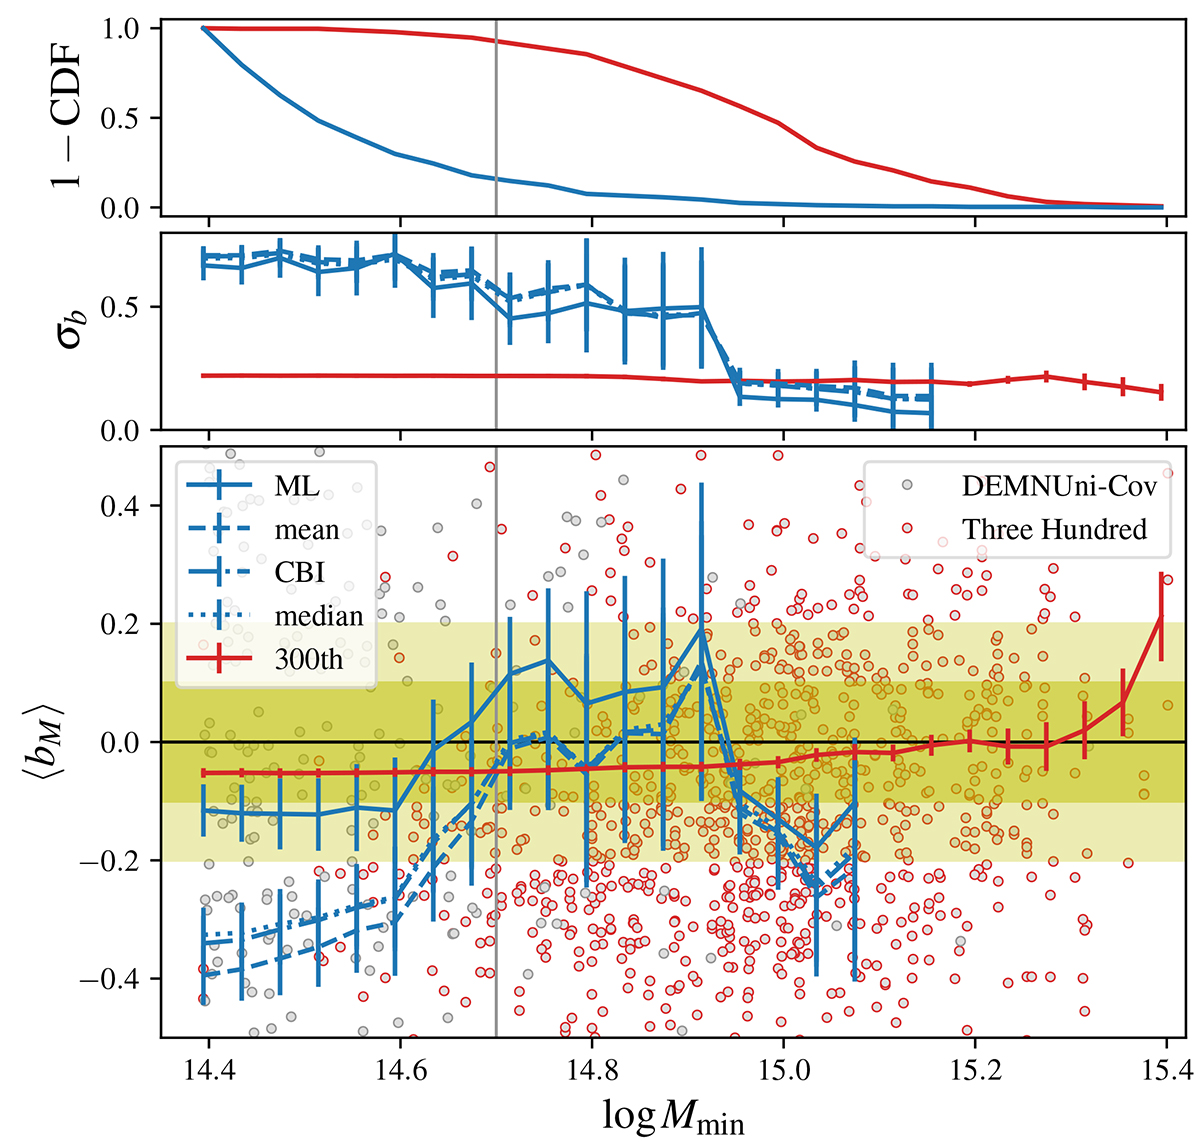
Fig. 6.
Download original image
Weighted average of the WL mass bias of DEMNUni-Cov clusters with Msim > Mmin as a function of Mmin. Results are compared with measurements performed on the Three Hundred cluster sample from ECG. Top panels give the fraction of clusters in the considered mass range (top) and the mass bias scatter (middle). The vertical line is at log Mmin = 14.7 lower limit. Error bars are the standard deviation of the bootstrap sample distribution.
Current usage metrics show cumulative count of Article Views (full-text article views including HTML views, PDF and ePub downloads, according to the available data) and Abstracts Views on Vision4Press platform.
Data correspond to usage on the plateform after 2015. The current usage metrics is available 48-96 hours after online publication and is updated daily on week days.
Initial download of the metrics may take a while.