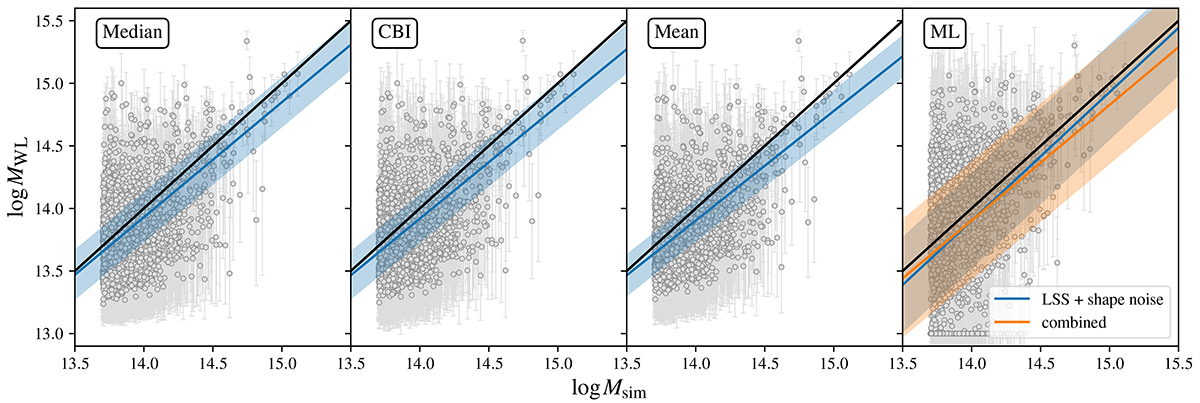
Fig. 4.
Download original image
Scatter plot for WL mass point estimates of DEMNUni-Cov clusters. Error bars correspond to the standard deviation of the mean (in the mean/ML panels), 16th and 84th percentiles (in the median panel), or SBI (in the CBI pannel). The one-to-one line is shown in black, while blue lines give results for the linear regression over the data points for the ‘LSS + shape noise’ case. The orange line shows the linear regression for ML WL mass measured on DEMNUni-Cov data with the combination of systematic effects discussed in Sect. 7. The shaded region corresponds to the scatter.
Current usage metrics show cumulative count of Article Views (full-text article views including HTML views, PDF and ePub downloads, according to the available data) and Abstracts Views on Vision4Press platform.
Data correspond to usage on the plateform after 2015. The current usage metrics is available 48-96 hours after online publication and is updated daily on week days.
Initial download of the metrics may take a while.