| Issue |
A&A
Volume 695, March 2025
|
|
|---|---|---|
| Article Number | A195 | |
| Number of page(s) | 10 | |
| Section | Catalogs and data | |
| DOI | https://doi.org/10.1051/0004-6361/202452011 | |
| Published online | 19 March 2025 | |
New ultracool dwarf candidates from multi-epoch WISE data
1
Institute of Physics, Czech Acad. Sci.,
182 21
Prague 8, Czech Republic
2
Institute of Astronomy,
48 Pyatnitskaya St.,
Moscow
119017, Russia
3
INAF – Osservatorio Astrofisico di Arcetri,
Largo E. Fermi 5,
50125
Firenze, Italy
★ Corresponding author; This email address is being protected from spambots. You need JavaScript enabled to view it.
Received:
27
August
2024
Accepted:
12
February
2025
Abstract
Context. Thirty years after the discovery of brown dwarfs, the search for these objects continues, particularly in the vicinity of the Sun. Objects near the Sun are characterized by large proper motions, making them be seen as fast-moving objects. While the Gaia DR3 catalog is a comprehensive source of proper motions, it lacks the depth needed for discovering fainter objects. Modern multi-epoch surveys, with their greater depth, offer a new opportunity to systematically search for ultracool dwarfs.
Aims. The study aims to systematically search for high-proper-motion objects using the newly released catalog of epochal Wide-field Infrared Survey Explorer (WISE) data in order to identify new brown dwarf candidates in the solar neighborhood, estimate their spectral types, distances, and spatial velocities.
Methods. We used recently released unTimely catalog of epochal detections in unWISE coadds to search for objects with high proper motions using a simple motion detection algorithm, combined with machine-learning-based artifact rejection routine. This method was used to identify objects with proper motions exceeding approximately 0.3 arcseconds per year. The identified objects were then cross-referenced with data from other large-scale sky surveys to further analyze their characteristics.
Results. The search yielded 21 885 moving objects with significant proper motions, 258 of which had not been previously published. All except 6 of them are compatible with being ultracool dwarfs. Among these, at least 33 were identified as most promising new T dwarf candidates, with estimated distances of closer than about 40 parsecs, and effective temperatures of less than 1300 K.
Key words: surveys / proper motions / brown dwarfs
© The Authors 2025
 Open Access article, published by EDP Sciences, under the terms of the Creative Commons Attribution License (https://creativecommons.org/licenses/by/4.0), which permits unrestricted use, distribution, and reproduction in any medium, provided the original work is properly cited.
This article is published in open access under the Subscribe to Open model. This email address is being protected from spambots. You need JavaScript enabled to view it. to support open access publication.
1 Introduction
Brown dwarfs are substellar objects with masses that are insufficient to start and maintain stable hydrogen fusion, which causes them to cool over time. They were theoretically predicted (Kumar 1963; Hayashi & Nakano 1963) and then later discovered (Rebolo et al. 1995; Nakajima et al. 1995). Since then, the search for new brown dwarfs and the systematic study of known ones has been a major problem in stellar astrophysics.
According to the studies (Mužić et al. 2017), brown dwarfs are estimated to constitute up to 25% of the stellar and sub- stellar objects in the Galaxy. Recent studies (Kirkpatrick et al. 2024) offer more conservative estimates, suggesting a star-to- brown dwarf ratio of 4:1. Searching for brown dwarfs is crucial for understanding the full spectrum of stellar and substellar populations in the Galaxy. Brown dwarfs are needed for advancing our understanding of the initial mass function, a key astrophysical tool for exploring star formation, the evolution of galaxies, and the distribution of stellar masses (Chabrier 2003; Kroupa et al. 2013; Raghu et al. 2024; Kirkpatrick et al. 2024; Kroupa et al. 2024). Finding new brown dwarfs enhances our understanding of Galactic kinematics and expands our understanding of stellar populations (Kirkpatrick et al. 2010; Smith et al. 2014; Luhman 2024). Additionally, investigating the atmospheres of brown dwarfs is vital for unraveling the complex processes that influence their temperature, composition, and cloud formation (Khandrika et al. 2013; Burningham et al. 2017), ultimately providing a deeper understanding of similar mechanisms in the atmospheres of gas giant exoplanets (Marley & Robinson 2015; Charnay et al. 2018; Tan & Showman 2019; Tremblin et al. 2019).
The search for brown dwarfs has evolved significantly over the years, building upon techniques initially developed for finding late-type M dwarfs in photographic surveys. Among these, photometric selection has emerged as the dominant strategy for searching for brown dwarfs in wide-field surveys. The method’s effectiveness relies on the key difference in spectral characteristics between the target objects and the majority of the background population. This distinction allows one to identify the specific region of color space that characterizes the primary brown dwarf population.
The searches based on the color selection method and the characterization of brown dwarfs were performed using DENIS (Delfosse et al. 1997; Phan-Bao et al. 2008), 2MASS (Kirkpatrick et al. 1999), SDSS (Fan et al. 2000; Chiu et al. 2006), UKIDSS (Day-Jones et al. 2013; Burningham et al. 2013), CFDBS (Delorme et al. 2008), WISE (Kirkpatrick et al. 2011), and most recently DES (Carnero Rosell et al. 2019; dal Ponte et al. 2023) surveys. In many cases, cross-matching different catalogs is useful. For example, the 2MASS passbands alone are not sufficient to distinguish brown dwarfs from stars of other classes, although they help in classifying subclasses of brown dwarfs. Furthermore, by combining optical data from Pan-STARRS with WISE data, researchers have successfully targeted L/T transition objects that are typically hard to detect in near-infrared surveys (Best et al. 2015, 2018).
Such selection, however, has rarely been perfect, even with a combination of various surveys. Photometric samples are often contaminated with extraneous objects, necessitating spectroscopic confirmation to establish reliable datasets. While the search conducted by Schmidt et al. (2010) utilized the SDSS DR7 spectroscopic database and resulted in the discovery of 210 new brown dwarfs, revealing that existing color selection methods are biased toward redder brown dwarfs, it is important to acknowledge that this was not the only spectroscopic search for brown dwarfs. Subsequent studies, such as Wang et al. (2022), who explored UCD spectra in LAMOST data, and Hsu et al. (2024), who performed a comprehensive analysis of UCD candidates in APOGEE DR17, have also contributed significantly to the field. Additionally, Langeveld et al. (2024) utilized JWST/NIRISS to identify brown dwarfs in NGC 1333.
Multiple brown dwarfs have recently been discovered at kiloparsec distances (see the results from the JADES/CEERS surveys (Hainline et al. 2024) and the UNCOVER (Burgasser et al. 2024a) survey). Furthermore, brown dwarfs have recently been discovered in the closest globular clusters (Gerasimov et al. 2024). However, most brown dwarfs are discovered in the nearest solar neighborhood, so their proper motions should be large compared to the majority of the field stars. Combined with the typically suboptimal angular resolution of infrared instruments, this significantly complicates the association of measurements between different datasets acquired at different epochs, leading to slower-moving objects predominantly being detected using color selection methods.
To overcome this bias, uniform datasets with dense multiepoch coverage are needed. The multi-epoch data from the 2MASS survey (Kirkpatrick et al. 2010) and the AllWISE Motion Survey (Kirkpatrick et al. 2014) with a spectroscopic follow-up have revealed previously unknown LT dwarfs and subdwarfs. The large-scale search for rapidly moving brown dwarfs is nowadays enabled by the CatWISE2020 (Marocco et al. 2021) catalog, which reports both infrared color and proper motions for nearly two billion objects over the whole sky. However, as the object detection in CatWISE2020 is performed on the coadded images combining all unWISE epochs, it is not optimal for finding rapidly moving stars, and prone to numerous spurious detections due to aggressive deblending applied to the data. Thus, projects like Backyard Worlds have to utilize a citizen science approach for visual inspection of many candidate sources in order to find actual moving objects (Kuchner et al. 2017; Rothermich et al. 2024; Marocco et al. 2024), as well as advanced machine-learning-based selection of brown dwarf candidates (Humphreys et al. 2020; Kota et al. 2022).
On the other hand, the recent release of the unTimely (Meisner et al. 2023) catalog of epochal detections in individual unWISE coadds opens the possibility of directly searching for the most rapidly moving objects. Here, we describe such a search, which we performed on W2 band data in order to specifically find new candidates for nearby ultracool dwarfs; that is, late M stars and brown dwarfs. In Section 2, we describe the algorithm and data that we used, as well as the moving objects that we detected. Section 3 contains a comparison of our method’s performance to other brown dwarf search efforts, and reviews the properties and possible classification of new ultracool dwarf candidates that we found. Finally, Section 4 concludes the work.
2 Data and analysis
The Wide-field Infrared Survey Explorer, or WISE (Wright et al. 2010), is a space telescope that performed all-sky survey initially in four infrared bands (W 1 at 3.4 µm, W2 at 4.6 µm, W3 at 12 µm, and W4 at 22 µm), and since the coolant depletion in late 2010 – in two shorter-wavelengths bands only. It repeatedly scanned the sky in great circles near a solar elongation of 90°, typically observing a given region of the sky over a period of 1 d every 6 months, with denser coverage closer to the ecliptic poles. unWISE coadds combine exposures from the same sky regions into a series of six-monthly visits, with an average of typical 12 exposures per band per visit (Meisner et al. 2019, 2018). These coadds are both sharper and deeper than original data used for producing initial AllWISE catalog (Cutri et al. 2021), and are the basis of unWISE (Schlafly et al. 2019) and CatWISE2020 (Marocco et al. 2021) catalogs greatly improving over it. However, these catalogs still did not provide either the detections or the measurements for the objects in individual epochs.
In order to systematically search for cool rapidly moving objects in the WISE data, we used the recently released unTimely catalog (Meisner et al. 2023), which is the result of the uniform analysis of individual epochal unWISE coadds (Meisner et al. 2019, 2018) using the crowdsource crowded-field photometry package (Schlafly et al. 2018; Schlafly 2021). It is currently distributed as a set of FITS tables, each corresponding to the objects detected in one of two filters (W 1 or W2) in individual epochal coadds for one of 18 240 sky tiles. Typically, every tile is covered with 15–17 unWISE coadds spanning approximately 11 years between January 2010 and December 2020 in every filter, but some of them (284 tiles, located close to the ecliptic poles) have significantly more, up to two hundred, epochs spanning the same time interval (Meisner et al. 2018).
Epochal catalogs are independent, and not cross-matched together, both between different epochs and between different filters in a single epoch. Therefore, as we are primarily interested in detecting cool objects, we processed only the catalogs in the W2 (4.6 µm) band. Moreover, to ensure the consistency of depths of catalogs from individual epochs, we excluded from the analysis the epochs for which the total number of contributing exposures (N_EXP field in the unTimely metadata table) was less than half the median value for that tile. We applied basic quality cuts to the objects from epochal catalogs by selecting only the detections from primary parts of unWISE coadds (primary==1) that had flux measured with a signal-to-noise ratio of at least 5. Additionally, we required the detections to have a sufficiently large fraction of flux inside the point spread function (PSF) that comes from this object (fracflux>0.5) to ensure that the detections are not subject to significant crowding, and thus have reliable astrometry and (less relevant for us) photometry. After initial experimenting, we decided not to perform any filtering on the “quality factor” (qf) field or flags derived either from unWISE coadds themselves (flags_unwise) or from crowdsource processing (flags_info) as they prevent most brighter objects from being detected, while not reducing significantly the amount of typical artifacts among the candidates. The positional accuracy of positions in epochal catalogs strongly depends on the source brightness. Our initial experiments demonstrated that crowdsource-measured uncertainties (dx and dy fields) adequately reflect it for objects fainter than eighth magnitude, while brighter ones show a significantly larger scatter, most probably due to being saturated. Therefore, we assumed a constant positional uncertainty of 1″ for the latter. Moreover, we detected a systematic bias between positions measured during forward (when the satellite is pointing “forward” in the direction of Earth’s orbit, see Meisner et al. 2018) and backward (when it is pointing in the opposite direction) scans of the sky. To compensate for it, we added an extra positional error of 0.15″ to all measurement uncertainties.
2.1 Motion detection algorithm
Actual motion detection was performed using an algorithm similar to the one implemented in, for example, Fasbender & Nidever (2021) and based on finding clusters of points located along the lines in a three-dimensional space of sky coordinates and time. However, in contrast to the optical data in Fasbender & Nidever (2021), it is enormously complicated by significant crowding and the relatively low positional accuracy of the catalog points, comparable to the actual proper motion of most objects over a ten-year time span.
After applying various quality cuts, as is described above, we analyzed the sets of all objects from epochal catalogs for every tile in order to find candidate moving objects. To do so, we converted their sky coordinates into standard coordinates relative to the tile center, and proceeded to detect linear structures in the resulting three-dimensional space (two angular coordinates plus time) using a simple “opportunistic” algorithm that considers all pairs of points from different epochs that satisfy the criteria of being separated by at least 3″ (slightly more than 1 pixel in unWISE coadds, and slightly less than half of the full width at half maximum of its PSF) but no more than 50″ (to reduce the computational complexity). This criterion ensures significant motion of the candidates, effectively placing a lower limit on the detectable proper motion of about 0.3″/year. In order to lower the contamination due to stationary objects, we excluded the pairs for which either of the points has other detections within 1″ in more than 60% of epochs with the same brightness, within the measurement uncertainties. We also excluded the pairs that contain the points already claimed by previously selected tracks (this way, the track is uniquely identified by its first point). Then, for every pair, we formed a candidate track, computed its expected positions for all the epochs available for that tile, and then selected the objects from corresponding epochs (this time without applying any additional criteria on top of initial quality cuts) that are closer than a 3σ positional uncertainty to these positions. We rejected the candidate tracks that do not have measurements in more than 60% of the epochs, corresponding to at least 10 epochs in a typical 16-epochal tile without low-quality epochs. We also required the modulo of the Pearson correlation coefficient of at least one angular coordinate with time to be at least 0.5. For the tracks passing these criteria, we computed the proper motion by performing robust linear regression of their standard coordinates versus time using the RANSAC (Fischler & Bolles 1981) algorithm, as it is implemented in the SCIKIT-LEARN (Pedregosa et al. 2011) Python package, in order to mitigate the influence of spurious associations with stationary objects, and then rejected the tracks for which the relative accuracy of the proper motion estimation was less than 0.33, ensuring that the candidate motion is significant. At this stage we also computed various statistical properties for the points belonging to the tracks after RANSAC filtering, as well as nearby catalog points from different epochs, to serve later as features for artifact rejection.
The candidates proposed by the algorithm are prone to both genuine image-level artifacts, especially due to long spikes around bright stars, and spurious tracks formed from individual detections of stationary objects located approximately along a line, especially for fainter candidates for which the individual detections had larger positional uncertainties. We could not find a way to reliably filter out either kind of artifact using the information available in the catalog files, and had to rely on the machine-learning-based filtering method that will be described in more detail below, and finally on the visual vetting of the candidates with a simple Jupyter-based (Beg et al. 2021) dashboard based on the WISEView (Meisner et al. 2018; Caselden et al. 2018) cutout API developed in the frame of the Backyard Worlds project (Kuchner et al. 2017). The dashboard displays, for every candidate, the cutouts from the first and last epochs at the object position, and the corresponding differences between these images and the median image of all epochs, and enables the easy selection of real moving objects by the characteristic dipoles in the latter images, as is shown in Figure 1. The dashboard displays up to several hundred candidates in a single page, along with interactive controls for flagging them as either artifacts or actual moving objects, with the ability to also directly check the epochal animations using the original WISEView web tool1 in unclear cases.
The algorithm returned 1 271 921 initial candidates from all tiles of the unTimely catalog. Despite the visual vetting dashboard allowing a person to inspect thousands of candidates in a relatively small amount of time, this amount was still too much. Therefore, we developed a simple iterative routine, akin to the one used by Kota et al. (2022), to extract “true” moving objects from them based on the random forest2 (Breiman 2001) binary classifier and a set of features for the candidates extracted by the algorithm, listed in Table 1. We bootstrapped the classifier by selecting and visually checking the candidates with the 60 largest (which all appeared to be true moving objects) and 60 smallest (which were all artifacts) values of the correlation of coordinates with time (corr parameter), and training the random forest on these objects. We then applied the classifier to all candidates, selected the hundred ones that had the largest predicted probability of being true, and visually inspected them. We then used derived labels to improve the classifier and repeated the whole process. Its progress is shown in Figure 2. We finished the process when the classifier stopped predicting new candidates with nonzero probabilities. At that point, we had visually vetted 21 885 candidates as real moving objects, and 37 437 as various artifacts. The other initial candidates never got a high score from the classifier, and thus are also artifacts. Their overall distribution is similar to the one of the visually vetted artifacts. We characterized the performance of the final classifier using leave- one-out cross-validation – by repeatedly excluding single points to serve as a test set, and training the model on the rest. After completing a full cycle, we estimated the mean precision of the classifier to be 99.6%, and the mean recall to be 96.5%.
Figure 3 shows the distribution of several features for both real moving objects and artifacts, both visually vetted and rejected by the classifier. The number of artifacts significantly grows toward a lower number of epochs, larger uncertainties of estimated proper motions, a larger photometric scatter, as well as toward the Galactic plane with the largest density of stationary objects.
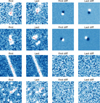 |
Fig. 1 Examples of images used to visually check the moving object candidates selected by the algorithm described in Section 2.1. Each row displays the cutouts from the first and last epochs in unWISE coadds, and the corresponding differences between the images and median of all available epochs. All cutouts are centered on the position of the object from the first epoch (so that it is in the center in the first and third columns). Red dots mark the positions of the objects from all available epochs, with the larger circle corresponding to the current epoch of the image. The first and second rows display the actual moving objects, for isolated and crowded fields, while the third one shows an artifact due to a bright star spike, and the last a spurious candidate due to linking together individual detections of several stationary objects located roughly along the line. |
Features used for the machine learning classifier.
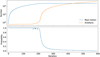 |
Fig. 2 Progress of machine-learning-based classification of initial candidates, as is described in Section 2.1. Upper panel: number of visually vetted real moving objects and artifacts at each iteration, from the pool of 1 271 921 initial candidates. Lower panel: threshold probability corresponding to 100 previously unclassified candidates with the highest score produced by the random forest binary classifier trained at each iteration. These candidates are then visually checked and used to improve the classifier on the next iteration. The procedure stops when the threshold probability falls to zero (the classifier stops producing new candidates for visual inspection). |
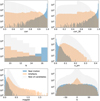 |
Fig. 3 Histograms of several features, defined in Table 1, for visually vetted real moving objects, visually vetted artifacts, and the other candidates rejected by the iterative machine learning classification described in Section 2.1. The other candidates never got a high score from the classifier, and their distribution is similar to the one of visually vetted artifacts. |
2.2 Performance verification
As a result of iterative machine-learning-based filtering of the initial candidates described above, we visually confirmed 21 885 (37% precision) moving objects among the 59 322 candidates that we manually inspected in total. In order to control the sensitivity of the algorithm to different values of the proper motion, we performed a run of the candidate extraction routine with the additional injection into every tile of 100 simulated objects with random positions, velocities, and brightnesses, and positional scatter corresponding to actual uncertainties for these brightnesses, as is described above. We processed these simulated objects together with actual data, so that they have the same density of background distractor points as real moving objects, and checked the fraction of these events successfully recovered by the algorithm. As was expected (see Figure 4), the algorithm detects practically no objects moving slower than 0.3″/year, but recovers all of the ones moving as fast as 10″ /year (corresponding to the fastest known star), and also most of the ones up to 20″/year, proving that our choice of algorithm parameters is sufficient for detecting even the fastest moving objects at stellar distances.
As we simulated the data on a catalog level, we expect that this test does not include all the selection effects affecting real data. Moreover, it does not include the machine learning classification step (as the simulation does not realistically reproduce all the data properties needed for computing the features). Therefore, we also validated the algorithm by cross-matching moving objects we detected with the UltracoolSheet (Best et al. 2024a; Best et al. 2021, 2024b) compilative database of ultracool dwarfs3, which contains the most comprehensive list of known nearby cool objects. We filtered it to only contain entries that have WISE associations, to ensure that they are potentially visible, and checked the fraction that is actually detected by the algorithm and that passed machine learning filtering, as is described above. As is shown in Figure 4, the efficiency estimated this way is consistent with simulations for brighter objects (W2 < 15) and is slightly less for fainter ones due to the unTimely epochal catalogs not being as deep as CatWISE2020 based on full unWISE coadds (Marocco et al. 2021).
To assess the accuracy of the proper motion determination by the algorithm, we performed a cross-match of detected objects with the Gaia DR3 catalog (Gaia Collaboration 2023) by propagating the object positions to its J2016.0 epoch, using a 2″ matching radius, and only considering Gaia objects with significant proper motions to avoid confusion with faint stationary background stars. This way, we found the associations for 20 555 (94%) of all candidates. For 104 more candidates, mostly brighter ones, for which Gaia DR3 did not provide an association, we found matching counterparts in the Gaia DR2 catalog. Figure 5 shows that the agreement of proper motions is sufficiently good and unbiased for its whole range, except for the slowest objects with shortest arcs, for which our measurements tend to be overestimated so that they pass the 0.3″ /year algorithm threshold.
We also cross-matched the candidates with the Cat- WISE2020 (Marocco et al. 2021) catalog by propagating their positions to J2015.4 (MJD=57 170) epoch, using catalog columns corresponding to proper-motion-corrected positions for that epoch, and conservatively assuming a 3″ (slightly more than the unWISE coadd pixel size) matching radius. While we do find associations for most candidates (except for 1052 that are most probably either too bright or located close to imaging artifacts), for a significant number of them the association is not unique and contains, in addition to seemingly unbiased ones with comparable proper motions and fluxes, counterparts that are ~1 magnitude fainter and that have ~1″/year greater velocity. We attribute these spurious associations to systematic deblending problems in the catalog introducing artificial detections. This also manifests in a huge number of bogus high-proper-motion objects in the catalog, making its use problematic for searching for actual moving objects. However, we tend to believe that photometric measurements there are superior to unTimely catalog ones, and we use these magnitudes for our objects in the analysis below.
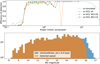 |
Fig. 4 Upper panel: efficiency of the moving object detection algorithm, estimated as is described in Section 2.2 by either injecting simulated entries into unTimely epoch catalogs (only detection per se is characterized), or by comparing the results with the list of known ultracool dwarfs from UltracoolSheet (Best et al. 2024a) (both detection and machine-learning-based filtering are characterized) for different brightnesses in the WISE W2 band. As was expected, the majority of objects faster than ~0.3″/year are successfully detected, with a nearly 100% efficiency for the objects brighter than W2 < 15, and an expected slight performance loss for fainter ones due to the epochal unTimely detection limit being worse than the CatWISE2020 (Marocco et al. 2021) one. The algorithm is equally efficient for the objects moving as fast as 10″/year, and still has an expected efficiency of 82% at 20″/year. Lower panel: histogram of the W2 magnitude for known UltracoolSheet objects moving faster than 0.4″/year, and its subset detected here. |
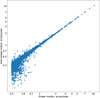 |
Fig. 5 Comparison of the proper motions measured in this work with values from Gaia DR3 (Gaia Collaboration 2023). The agreement with Gaia proper motions is sufficiently good, with the spread increasing toward smaller values as the track length in unTimely data becomes too small to permit accurate measurement. |
2.3 New high-proper-motion objects
We checked for associated SIMBAD (Wenger et al. 2000) database entries for all 21 885 objects with high proper motions that we detected. As SIMBAD is highly heterogeneous and does not generally provide the epochs for the coordinates listed there, we computed for every candidate a number of trial positions propagated to the epochs from J1990.0 till J2021.0 with a step small enough to accommodate for the candidate’s proper motion, and looked for SIMBAD entries within 5″ from these positions. We only considered relevant types of objects, excluding for example extragalactic sources or objects from spectral ranges other than optical and infrared. This way, we found the associations for all objects except for 515. Among them, 192 have counterparts with measured proper motions in Gaia DR3 or DR2 catalogs. After an initial analysis of their colors, we did not find among them candidates consistent with spectral types later than L0, so, like Brooks et al. (2024), we decided to exclude them from the analysis but use them later to assess the reliability of our estimations (see Section 3. Among the rest, 2 objects are listed in UltracoolSheet (Best et al. 2024a; Best et al. 2021, 2024b) compilative database of ultracool dwarfs, 19 are in the list of ultracool dwarf candidates from DES 6-year data (dal Ponte et al. 2023), 38 were recently found in unWISE images by Brooks et al. (2024), and 6 more were recently reported in a spectroscopic study of cool subdwarfs from Backyard Worlds by Burgasser et al. (2024b). We excluded them all from our final list (again, keeping them to cross-check the performance of our analysis), leaving us with 258 new moving objects.
Three of them also have no counterparts in the Cat- WISE2020 (Marocco et al. 2021) catalog. For them, we used mean values4 of unTimely epochal measurements for W1 and W2 band magnitudes; for the rest, we directly used Cat- WISE2020 magnitudes as they are more accurate, especially for the W1 band, and less prone to be biased due to variable crowding.
We collected additional photometric data for these objects by cross-matching their expected positions at corresponding epochs with several large-scale optical and IR catalogs that have measurement epochs for their detections – the 2MASS point source catalog (Skrutskie et al. 2006), the catalog of Pan-STARRS DR2 epochal (“warp”) detections (Chambers et al. 2016), VISTA Hemisphere Survey (McMahon et al. 2013), UKIRT Hemisphere Survey (Dye et al. 2018) epochal detections, SkyMapper DR4 (Onken et al. 2024) epochal detections, Sloan Digital Sky Survey DR16 (Ahumada et al. 2020), DENIS (Denis 2005), NOIRLab Source Catalog DR2 (Nidever et al. 2021), and DELVE DR2 (Drlica-Wagner et al. 2022), with the search radius large enough to accommodate for both the expected position and catalog uncertainties. We then visually inspected all the associations to ensure that, together with epochal unTimely detections, they form both a consistent trajectory and a consistent spectral energy distribution. To assess the latter, we fit the measurements with the grid of spectra for BT-Settl model atmospheres (Allard 2014) using VO SED Analyzer (VOSA5) (Bayo et al. 2008). After excluding spurious associations, we got both improved proper motion estimates, sets of photometric measurements in the optical and IR bands, and the effective temperatures from the spectral fits for 223 objects, as is shown in Figure 6. The spectral type can then be estimated by interpolating the values from the Mamajek table of mean colors and effective temperatures for dwarf stars6.
Two-color diagrams constructed from measurements in different IR bands are shown in Figure 7, together with the positions and spectral classes of known ultracool dwarfs from UltracoolSheet, and template ultracool dwarf colors from dal Ponte et al. (2023). For 38 of the new moving objects, we did not get enough (at least five) multiwavelength points for the VOSA model fit, so no temperature estimates are available for them. However, for some of them the data from shorter wavelengths are still available (see e.g., left panel of Figure 7) and can be used to assess their spectral type using a number of nearest neighbors from UltracoolSheet with known spectral types in corresponding two- color spaces (on the order of J – W1 vs. W1 – W2, y – W1 vs. W1 – W2, ɀ– W1 vs. W1 – W2, and i– W1 vs. W1 – W2). The scatter of spectral types among nearest neighbors will then define the error for the estimation. This way, we estimated the spectral types for 27 of these objects. For the rest, we can use a single W 1 – W2 color as a regressor for the spectral type, again using UltracoolSheet data, and average among all its entries with the color lying within the corresponding error bars for our objects. Again, the scatter of catalog spectral types in the subset will define the error of the estimated spectral type. We do not expect this method to be accurate for W1 – W2 < 0.5, but for redder objects (L9 and later types) we consider such an estimation to be reasonable. Figure 8 shows the comparison between published spectral types for the objects that our dataset without SIMBAD or Gaia associations has in common with UltracoolSheet (Best et al. 2024a), Brooks et al. (2024), or Burgasser et al. (2024b), with our best estimates made as was described above. It shows a good agreement, especially for later types, except for several outliers that we believe to be misclassifications in Brooks et al. (2024) due to spurious measurements from shorter wavelengths included in the template fits there.
Table 2 summarizes the parameters of 258 new moving objects that we found, both astrometric (positions and proper motions) and photometric (from multiwavelength associations), along with inferred effective temperatures and spectral types. Two hundred and fourteen of the objects have estimated temperatures colder than 2700 K, and thus are ultracool dwarfs. For 38 more, spectral types estimated from infrared colors are later than M7, making them ultracool dwarf candidates also.
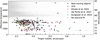 |
Fig. 6 High-proper-motion objects detected in this work that do not have SIMBAD associations. Proper motions were estimated using both unTimely data and additional associations from several multiwavelength photometric catalogs. Effective temperatures are from the fit of these photometric data with the grid of BT-Settl (Allard 2014) model spectra, as is described in Section 2.3. Colored symbols represent known objects that we also detected and characterized, which have already been published in UltracoolSheet (Best et al. 2024a; Best et al. 2021, 2024b), Brooks et al. (2024), dal Ponte et al. (2023), or Burgasser et al. (2024b), and which thus are excluded from the final list. Vertical black vertical ticks at the bottom mark the proper motions of new objects that do not have enough multiwavelength associations for spectral fitting. The secondary vertical axis on the right shows the spectral types corresponding to the effective temperatures according to Pecaut & Mamajek (2013). Light gray points in the background show the Gaia DR3 stars within 100 pc with effective temperatures estimated using the GSP-Phot pipeline (Andrae et al. 2023). |
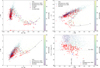 |
Fig. 7 Positions of the new moving objects we detected (red circles with error bars) in infrared two-color and reduced J magnitude diagrams for the known ultracool dwarfs from UltracoolSheet (Best et al. 2024a). The colors of known objects correspond to their spectral class according to the color bars to the right of the plots. The blue points show spectroscopically confirmed T subdwarfs from Burgasser et al. (2024b) that we also detected. The black line marks the template colors of ultracool dwarfs according to dal Ponte et al. (2023). The vertical red ticks at the bottom of the left panel mark the WISE color of objects that do not have associated J band measurements. Purple points also mark the objects for which we did not get enough multiwavelength data for the VOSA spectral fit, but for which J band data are still available. Dashed black lines in the bottom right panel mark the criteria for the selection of candidate T subdwarfs in Burgasser et al. (2024b). |
3 Discussion
We successfully detected 21 885 moving objects in Section 2.1, including the largest proper motion brown dwarf, WISEA J085510.74-071442.5 (Luhman 2014), as well as the fastest known star, Barnard’s Star, and the majority of known high-proper-motion ultracool dwarfs from UltracoolSheet (Best et al. 2024a; Best et al. 2021, 2024b). However, we did not detect anything moving faster than that, despite the algorithm specifically being tailored to be sensitive to even the largest possible proper motions (see Figure 4).
Our algorithm facilitated the identification of 21 885 confirmed moving objects from 59 322 candidates through visual inspection. This approach demonstrated a notable advancement over prior methods. For instance, the image-based neural network SMDET, applied to unWISE coadds, identified 1730 real proper motion objects from 11 900 inspected candidates (Brooks et al. 2024). Additionally, our algorithm uncovered 323 moving objects without SIMBAD and Gaia associations – nearly three times more than the 118 reported in a similar range of proper motions by Brooks et al. (2024) – while successfully recovering 38 objects from their sample.
The process of visually inspecting initial candidates and identifying moving objects based on their visual signatures (see Figure 1) closely resembles the approach used by the Backyard Worlds: Planet 9 citizen science project (Kuchner et al. 2017), which involves tens of thousands of participants and has been ongoing for seven years. However, by leveraging a motion detection algorithm to generate track candidates, applying a machine-learning-based artifact rejection routine, and utilizing a compact, Jupyter-based dashboard, our visual inspection process is significantly more fast and efficient.
The Backyard Worlds: Cool Neighbors (Humphreys et al. 2020) citizen science project refines the original by also using an input list of positions – in their case, selected from the CatWISE2020 (Marocco et al. 2021) catalog using a machine learning classifier tailored specifically for finding new T and L brown dwarfs, with an expected precision of about 0.5% due to a large amount of spurious high-proper-motion entries polluting the catalog. In contrast to them, our method is not restricted to finding just brown dwarfs, and is better suited for detecting high-proper-motion objects, which is difficult for Cat- WISE2020 (Marocco et al. 2021). Moreover, among 258 new moving objects, we detected three that lack CatWISE2020 associations, proving that our approach is also complementary to the ones based on that catalog, such as Humphreys et al. (2020) or Kota et al. (2022).
On the other hand, our approach is limited by the reduced sensitivity and potential selection effects of the epochal detections in unTimely catalog, especially in more crowded fields. Therefore, we cannot claim that our motion census is comprehensive, and envision that additional studies – especially image-based ones, such as image differencing or shift-and-stack approaches – may still reveal additional moving objects in the WISE dataset.
Figure 9 shows the sky positions of the newly detected objects in Galactic coordinates. It is consistent with the isotropic distribution expected for nearby Galactic objects. We can qualitatively assess the distances to them by regressing the absolute W2 magnitudes of objects with known parallaxes from the 20pc census of stars and brown dwarfs (Kirkpatrick et al. 2024) versus their spectral types, and then applying the same dependency (along with corresponding scatter) for best spectral type estimates from our sample, as is described in Section 2.3. This then allows (if we ignore the reddening that is reasonable for such nearby objects) us to estimate the distance (“photometric distance”) using observed W2 magnitudes with a formal accuracy that is typically better than 20%, as well as to estimate projected velocities with a comparable accuracy, as is shown in Figure 11. A comparison of these photometric distances with astrometric ones for the objects we detected in Section 2.3 that lack SIMBAD associations but that do have a Gaia DR3 or DR2 counterpart is shown in the left panel of Figure 10. While Gaia- detected objects all have spectral types earlier than M9, we can still see that photometric distances are, within the errors, compatible with the parallaxes, for most of the colder objects. Starting with a spectral type of approximately M3 and earlier, the estimation becomes biased and significantly (by about a factor of two) overestimates the distance for late K types. We cannot easily guess the reason for this behavior, but it may explain the anomalously high distances and projected velocities for the two hottest objects in our actual new objects sample shown in Figure 11. The other objects there should not be affected by this problem, and we can consider their photometric distances to be reliable. On the other hand, the agreement between the effective temperatures estimated in Section 2.3 with the ones derived using the Gaia DR3 GSP-Phot pipeline (Andrae et al. 2023) is sufficiently good up to at least Teff = 4300 K, or the K6 spectral type (see right panel of Figure 10).
Among the 258 new objects that we detected, all except 6 are compatible with being ultracool dwarfs colder than the M7 type. At least 62 are consistent with being brown dwarfs of types later than T0; that is, having Teff < 1300 K or W1 – W2 > 0.7. Among them, 33 have effective temperatures estimated using BT-Settl spectral grid, and thus may be considered the most reliable new T brown dwarf candidates that require further spectroscopic study to be confirmed. They all have estimated distances of 20–40 pc, with the closest one – CWISE J154802.28+565802.2 – being at a 18.1 ± 2.6pc distance and having an estimated spectral type of T8. We did not detect any new hypervelocity star (Brown 2015) (the two objects with a formal projected velocity exceeding 1000 km/s in Figure 11 are most probably due to an overestimated distance, see above), and no brown dwarf candidate with a projected velocity significantly greater than ~500 km/s.
The relatively small proper motions of new objects, which all move slower than 1″/year, argue against any of them having a Solar System origin. Indeed, even a hypothetical brown dwarf companion of the Sun in the vicinity of the aphelion of a very eccentric orbit would exhibit a proper motion of about 4.6″/year (Malkov 2023). Bodies of the inner Solar System all have even faster motions that are again incompatible with the ones of newly found objects.
In our dataset, we detected four of the spectroscopically confirmed T subdwarfs recently reported by Burgasser et al. (2024b). For two of them, we have VOSA-estimated effective temperatures that agree well with the published values. Figure 7 shows their positions in the two-color diagrams, as well as in the reduced J magnitude versus J– W2 color one, alongside with the rest of our objects. A number of them satisfy the selection criteria for T subdwarf candidates that Burgasser et al. (2024b) used, so we can assume that at least some of them might also be subdwarfs. As is shown in Figure 8, we can expect our spectral types to be underestimated for them, but as Figure 10 demonstrates, their effective temperatures should still be estimated correctly. The accuracy and spectral coverage of the photometric data we assembled are not enough to allow us to reliably identify subdwarfs through their subsolar metallicity using model fitting, so we did not perform any additional study for these potential subdwarf candidates.
As Figure 11 shows, the new objects that we detected are on the systematically faster, colder and more distant side of the overall distribution of already known ultracool dwarfs, while not being extreme due to the limitations of unTimely catalog. Their overall spread is very similar to the sample of 118 objects discovered by Brooks et al. (2024), and is defined by the selection effects – minimal detectable proper motion from one side, and the fact that most of faster-moving objects were already detected in AllWISE (Kirkpatrick et al. 2014) on the other side – the same for both this work and Brooks et al. (2024). On the other hand, our results suggest that there is still a place for new discoveries of brown dwarfs within this range of parameters, even before new instrumentation like the James Webb Space Telescope, the Vera C. Rubin Observatory, or the Nancy Grace Roman Space Telescope expand the horizons of brown dwarf science (Gizis et al. 2022; Langeveld et al. 2024; Ryan et al. 2022).
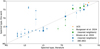 |
Fig. 8 Comparison between published spectral types for the objects that have neither SIMBAD nor Gaia associations but are present in either UltracoolSheet (Best et al. 2024a), Brooks et al. (2024) or Burgasser et al. (2024b), with our best estimates done using the VOSA spectral fit based on the BT-Settl model grid (circles), using the nearest UltracoolSheet neighbors in the two-color plots akin to Figure 7 (squares), or by using UltracoolSheet objects with similar W 1 – W2 colors (stars). The error bars correspond to the 96% (2σ) confidence limits of the corresponding estimations. Two significant outliers in the upper left corner are CWISE J220134.02-041609.5 and CWISE J230252.77-131458.0, which both have very large χ2 values in Brooks et al. (2024) indicating bad fits there, so we consider our late type estimations for them to be more correct. The VOSA effective temperatures for three objects from Burgasser et al. (2024b) agree well with the published values, while their spectral types are underestimated (green circles below the equality line) due to differences in the temperature to spectral type mapping for subdwarfs from the Pecaut & Mamajek (2013) ones that we used. |
New high-proper-motion objects detected in this work.
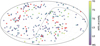 |
Fig. 9 Positions of the detected moving objects in Galactic coordinates, with the estimated spectral type represented by the marker color. The objects with no such estimates are colored in red. The ecliptic plane is shown with a dashed black line. |
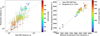 |
Fig. 10 Left panel: comparison of the Gaia DR3/DR2 distances for the moving objects lacking SIMBAD associations with photometric distances derived in Section 3. The distances estimated using interpolation of MW2 absolute magnitudes are in good agreement with astrometric ones for the objects colder than approximately an M3 spectral type, and are significantly overestimated for earlier types. Right panel: comparison of effective temperatures for the same objects estimated by Gaia DR3 GSP-Phot pipeline (Andrae et al. 2023), with the ones derived in this work using grid of BT-Settl model spectra implemented in VOSA (Bayo et al. 2008). The colors of the dots show the distances from Gaia DR3. The overall agreement between VOSA and GSP-Phot estimations is sufficiently good. Additionally, black stars represent the subdwarfs from Burgasser et al. (2024b) with effective temperatures derived from NIR spectra that overlap with our sample. Our estimated temperatures are also in good agreement with them. |
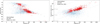 |
Fig. 11 Distances and spectral types (left panel), and distances and projected velocities (right panel) for new moving objects discovered in this work (red points) in comparison to known ultracool dwarfs from UltracoolSheet (Best et al. 2024a) (blue points) and all 118 objects discovered by Brooks et al. (2024) (black stars). The distances for new objects were estimated by interpolating MW2 absolute magnitudes using nearby stars from the 20-pc census of Kirkpatrick et al. (2024), and then used for converting proper motions to projected velocities. The diagonal gray lines in the right panel correspond to fixed values of proper motion. |
4 Conclusions
We performed a systematic search for objects with high proper motions in W2 band WISE data using the recently released unTimely epochal catalog, and successfully identified 21 885 objects moving faster than 0.3″/year. Our estimations of their proper motions are in good agreement with Gaia DR3 measurements when they are available. We did not detect any object moving faster than approx. 10″/year, but were able to successfully recover both the WISEA J085510.74-071442.5 brown dwarf with the largest known proper motion and most other known rapidly moving normal stars and nearby ultracool dwarfs. We also identified 258 objects that do not have associated records in the SIMBAD database or Gaia catalogs and that had not been published previously. We assembled multiwavelength information for them by cross-matching their trajectories with large optical and infrared catalogs, and used their colors to estimate their effective temperatures, spectral types, distances, and projected velocities. Of these, 252 are compatible with being ultracool dwarfs, and at least 33 are reliable T brown dwarf candidates with estimated distances closer than 40 pc and effective temperatures colder than 1300 K.
Data availability
The full Table 2 is available at the CDS via anonymous ftp to cdsarc.cds.unistra.fr (130.79.128.5) or via https://cdsarc.cds.unistra.fr/viz-bin/cat/J/A+A/695/A195
Acknowledgements
This work was co-funded by the EU and supported by the Czech Ministry of Education, Youth and Sports (project CZ.02.01.01/00/22_008/0004632 – FORTE). This work has benefitted from The UltracoolSheet at http://bit.ly/UltracoolSheet, maintained by Will Best, Trent Dupuy, Michael Liu, Aniket Sanghi, Rob Siverd, and Zhoujian Zhang, and developed from compilations by Dupuy & Liu (2012, ApJS, 201, 19), Dupuy & Kraus (2013, Science, 341, 1492), Deacon et al. (2014, ApJ, 792, 119), Liu et al. (2016, ApJ, 833, 96), Best et al. (2018, ApJS, 234, 1), Best et al. (2021, AJ, 161, 42), Sanghi et al. (2023, ApJ, 959, 63), and Schneider et al. (2023, AJ, 166, 103). This publication makes use of VOSA, developed under the Spanish Virtual Observatory (https://svo.cab.inta-csic.es) project funded by MCIN/AEI/10.13039/501100011033/ through grant PID2020-112949GB-I00. VOSA has been partially updated by using funding from the European Union’s Horizon 2020 Research and Innovation Programme, under Grant Agreement No 776403 (EXOPLANETS-A).
References
- Ahumada, R., Allende Prieto, C., Almeida, A., et al. 2020, ApJS, 249, 3 [NASA ADS] [CrossRef] [Google Scholar]
- Allard, F. 2014, IAU Symp., 299, 271 [Google Scholar]
- Andrae, R., Fouesneau, M., Sordo, R., et al. 2023, A&A, 674, A27 [CrossRef] [EDP Sciences] [Google Scholar]
- Bayo, A., Rodrigo, C., Barrado y Navascués, D., et al. 2008, A&A, 492, 277 [NASA ADS] [CrossRef] [EDP Sciences] [Google Scholar]
- Beg, M., Taka, J., Kluyver, T., et al. 2021, Comput. Sci. Eng., 23, 36 [Google Scholar]
- Best, W. M. J., Liu, M. C., Magnier, E. A., et al. 2015, ApJ, 814, 118 [CrossRef] [Google Scholar]
- Best, W. M. J., Magnier, E. A., Liu, M. C., et al. 2018, ApJS, 234, 1 [Google Scholar]
- Best, W. M. J., Liu, M. C., Magnier, E. A., & Dupuy, T. J. 2021, AJ, 161, 42 [Google Scholar]
- Best, W. M. J., Dupuy, T. J., Liu, M. C., et al. 2024a, https://doi.org/10.5281/zenodo.10573247 [Google Scholar]
- Best, W. M. J., Sanghi, A., Liu, M. C., Magnier, E. A., & Dupuy, T. J. 2024b, ApJ, 967, 115 [NASA ADS] [CrossRef] [Google Scholar]
- Breiman, L. 2001, Mach. Learn., 45, 5 [Google Scholar]
- Brooks, H., Caselden, D., Kirkpatrick, J. D., et al. 2024, AJ, 168, 211 [NASA ADS] [CrossRef] [Google Scholar]
- Brown, W. R. 2015, ARA&A, 53, 15 [Google Scholar]
- Burgasser, A. J., Bezanson, R., Labbe, I., et al. 2024a, ApJ, 962, 177 [NASA ADS] [CrossRef] [Google Scholar]
- Burgasser, A. J., Schneider, A. C., Meisner, A. M., et al. 2024b, arXiv e-prints [arXiv:2411.01378] [Google Scholar]
- Burningham, B., Cardoso, C. V., Smith, L., et al. 2013, MNRAS, 433, 457 [CrossRef] [Google Scholar]
- Burningham, B., Marley, M. S., Line, M. R., et al. 2017, MNRAS, 470, 1177 [NASA ADS] [CrossRef] [Google Scholar]
- Carnero Rosell, A., Santiago, B., dal Ponte, M., et al. 2019, MNRAS, 489, 5301 [NASA ADS] [CrossRef] [Google Scholar]
- Caselden, D., Westin, Paul, I., Meisner, A., Kuchner, M., & Colin, G. 2018, Astrophysics Source Code Library [record ascl:1806.004] [Google Scholar]
- Chabrier, G. 2003, PASP, 115, 763 [Google Scholar]
- Chambers, K. C., Magnier, E. A., Metcalfe, N., et al. 2016, arXiv e-prints [arXiv:1612.05560] [Google Scholar]
- Charnay, B., Bézard, B., Baudino, J. L., et al. 2018, ApJ, 854, 172 [Google Scholar]
- Chiu, K., Fan, X., Leggett, S. K., et al. 2006, AJ, 131, 2722 [Google Scholar]
- Cutri, R. M., Wright, E. L., Conrow, T., et al. 2021, VizieR On-line Data Catalog: II/328 [Google Scholar]
- dal Ponte, M., Santiago, B., Carnero Rosell, A., et al. 2023, MNRAS, 522, 1951 [NASA ADS] [CrossRef] [Google Scholar]
- Day-Jones, A. C., Marocco, F., Pinfield, D. J., et al. 2013, MNRAS, 430, 1171 [NASA ADS] [CrossRef] [Google Scholar]
- Delfosse, X., Tinney, C. G., Forveille, T., et al. 1997, A&A, 327, L25 [NASA ADS] [Google Scholar]
- Delorme, P., Delfosse, X., Albert, L., et al. 2008, A&A, 482, 961 [NASA ADS] [CrossRef] [EDP Sciences] [Google Scholar]
- Denis, C. 2005, VizieR On-line Data Catalog: B/denis [Google Scholar]
- Drlica-Wagner, A., Ferguson, P. S., Adamów, M., et al. 2022, ApJS, 261, 38 [NASA ADS] [CrossRef] [Google Scholar]
- Dye, S., Lawrence, A., Read, M. A., et al. 2018, MNRAS, 473, 5113 [Google Scholar]
- Fan, X., Knapp, G. R., Strauss, M. A., et al. 2000, AJ, 119, 928 [NASA ADS] [CrossRef] [Google Scholar]
- Fasbender, K. M., & Nidever, D. L. 2021, AJ, 162, 244 [NASA ADS] [CrossRef] [Google Scholar]
- Fischler, M. A., & Bolles, R. C. 1981, Commun. ACM, 24, 381 [CrossRef] [Google Scholar]
- Gaia Collaboration (Vallenari, A., et al.) 2023, A&A, 674, A1 [NASA ADS] [CrossRef] [EDP Sciences] [Google Scholar]
- Gerasimov, R., Bedin, L. R., Burgasser, A. J., et al. 2024, ApJ, 971, 65 [NASA ADS] [CrossRef] [Google Scholar]
- Gizis, J. E., Yoachim, P., Jones, R. L., Hilligoss, D., & Ji, J. 2022, ApJS, 263, 23 [NASA ADS] [CrossRef] [Google Scholar]
- Hainline, K. N., Helton, J. M., Johnson, B. D., et al. 2024, ApJ, 964, 66 [NASA ADS] [CrossRef] [Google Scholar]
- Hayashi, C., & Nakano, T. 1963, Prog. Theor. Phys., 30, 460 [CrossRef] [Google Scholar]
- Hsu, C.-C., Burgasser, A. J., Theissen, C. A., et al. 2024, ApJS, 274, 40 [NASA ADS] [CrossRef] [Google Scholar]
- Humphreys, A., Schapera, N., Meisner, A. M., et al. 2020, ASP Conf. Ser., 525, 57 [NASA ADS] [Google Scholar]
- Khandrika, H. G., Burgasser, A. J., Melis, C., et al. 2013, AJ, 145, 71 [NASA ADS] [CrossRef] [Google Scholar]
- Kirkpatrick, J. D., Reid, I. N., Liebert, J., et al. 1999, ApJ, 519, 802 [NASA ADS] [CrossRef] [Google Scholar]
- Kirkpatrick, J. D., Looper, D. L., Burgasser, A. J., et al. 2010, ApJS, 190, 100 [Google Scholar]
- Kirkpatrick, J. D., Cushing, M. C., Gelino, C. R., et al. 2011, ApJS, 197, 19 [NASA ADS] [CrossRef] [Google Scholar]
- Kirkpatrick, J. D., Schneider, A., Fajardo-Acosta, S., et al. 2014, ApJ, 783, 122 [NASA ADS] [CrossRef] [Google Scholar]
- Kirkpatrick, J. D., Marocco, F., Gelino, C. R., et al. 2024, ApJS, 271, 55 [NASA ADS] [CrossRef] [Google Scholar]
- Kota, T., Kirkpatrick, J. D., Caselden, D., et al. 2022, AJ, 163, 116 [NASA ADS] [CrossRef] [Google Scholar]
- Kroupa, P., Weidner, C., Pflamm-Altenburg, J., et al. 2013, Planets Stars Stellar Syst., 5, 115 [NASA ADS] [CrossRef] [Google Scholar]
- Kroupa, P., Gjergo, E., Jerabkova, T., & Yan, Z. 2024, arXiv e-prints [arXiv:2410.07311] [Google Scholar]
- Kuchner, M. J., Faherty, J. K., Schneider, A. C., et al. 2017, ApJ, 841, L19 [NASA ADS] [CrossRef] [Google Scholar]
- Kumar, S. S. 1963, ApJ, 137, 1121 [Google Scholar]
- Langeveld, A. B., Scholz, A., Mužić, K., et al. 2024, AJ, 168, 179 [Google Scholar]
- Luhman, K. L. 2014, ApJ, 786, L18 [Google Scholar]
- Luhman, K. L. 2024, AJ, 168, 159 [NASA ADS] [CrossRef] [Google Scholar]
- Malkov, O. Y. 2023, Astron. Rep., 67, 288 [NASA ADS] [CrossRef] [Google Scholar]
- Marley, M. S., & Robinson, T. D. 2015, ARA&A, 53, 279 [Google Scholar]
- Marocco, F., Eisenhardt, P. R. M., Fowler, J. W., et al. 2021, ApJS, 253, 8 [Google Scholar]
- Marocco, F., Kirkpatrick, J. D., Schneider, A. C., et al. 2024, ApJ, 967, 147 [NASA ADS] [CrossRef] [Google Scholar]
- McMahon, R. G., Banerji, M., Gonzalez, E., et al. 2013, The Messenger, 154, 35 [NASA ADS] [Google Scholar]
- Meisner, A. M., Lang, D., & Schlegel, D. J. 2018, AJ, 156, 69 [NASA ADS] [CrossRef] [Google Scholar]
- Meisner, A. M., Lang, D., Schlafly, E. F., & Schlegel, D. J. 2019, PASP, 131, 124504 [CrossRef] [Google Scholar]
- Meisner, A. M., Caselden, D., Schlafly, E. F., & Kiwy, F. 2023, AJ, 165, 36 [NASA ADS] [CrossRef] [Google Scholar]
- Mužić, K., Schödel, R., Scholz, A., et al. 2017, MNRAS, 471, 3699 [CrossRef] [Google Scholar]
- Nakajima, T., Oppenheimer, B. R., Kulkarni, S. R., et al. 1995, Nature, 378, 463 [Google Scholar]
- Nidever, D. L., Dey, A., Fasbender, K., et al. 2021, AJ, 161, 192 [Google Scholar]
- Onken, C. A., Wolf, C., Bessell, M. S., et al. 2024, PASA, 41, e061 [NASA ADS] [CrossRef] [Google Scholar]
- Pecaut, M. J., & Mamajek, E. E. 2013, ApJS, 208, 9 [Google Scholar]
- Pedregosa, F., Varoquaux, G., Gramfort, A., et al. 2011, J. Mach. Learn. Res., 12, 2825 [Google Scholar]
- Phan-Bao, N., Bessell, M. S., Martín, E. L., et al. 2008, MNRAS, 383, 831 [NASA ADS] [CrossRef] [Google Scholar]
- Raghu, Y., Kirkpatrick, J. D., Marocco, F., et al. 2024, ApJ, 974, 222 [NASA ADS] [CrossRef] [Google Scholar]
- Rebolo, R., Zapatero Osorio, M. R., & Martín, E. L. 1995, Nature, 377, 129 [NASA ADS] [CrossRef] [Google Scholar]
- Rothermich, A., Faherty, J. K., Bardalez-Gagliuffi, D., et al. 2024, AJ, 167, 253 [NASA ADS] [CrossRef] [Google Scholar]
- Ryan, R. E., Thorman, P., Aganze, C., et al. 2022, ApJ, 932, 96 [NASA ADS] [CrossRef] [Google Scholar]
- Schlafly, E. F. 2021, Crowdsource: Crowded field photometry pipeline, Astrophysics Source Code Library [record ascl:2106.004] [Google Scholar]
- Schlafly, E. F., Green, G. M., Lang, D., et al. 2018, ApJS, 234, 39 [Google Scholar]
- Schlafly, E. F., Meisner, A. M., & Green, G. M. 2019, ApJS, 240, 30 [Google Scholar]
- Schmidt, S. J., West, A. A., Hawley, S. L., & Pineda, J. S. 2010, AJ, 139, 1808 [NASA ADS] [CrossRef] [Google Scholar]
- Skrutskie, M. F., Cutri, R. M., Stiening, R., et al. 2006, AJ, 131, 1163 [NASA ADS] [CrossRef] [Google Scholar]
- Smith, L., Lucas, P. W., Bunce, R., et al. 2014, MNRAS, 443, 2327 [Google Scholar]
- Tan, X., & Showman, A. P. 2019, ApJ, 874, 111 [NASA ADS] [CrossRef] [Google Scholar]
- Tremblin, P., Padioleau, T., Phillips, M. W., et al. 2019, ApJ, 876, 144 [Google Scholar]
- Wang, Y.-F., Luo, A. L., Chen, W.-P., et al. 2022, A&A, 660, A38 [NASA ADS] [CrossRef] [EDP Sciences] [Google Scholar]
- Wenger, M., Ochsenbein, F., Egret, D., et al. 2000, A&AS, 143, 9 [NASA ADS] [CrossRef] [EDP Sciences] [Google Scholar]
- Wright, E. L., Eisenhardt, P. R. M., Mainzer, A. K., et al. 2010, AJ, 140, 1868 [Google Scholar]
Available at http://byw.tools/wiseview
We used the random forest classifier implementation from SCIKIT-LEARN (Pedregosa et al. 2011), with 100 estimators and automatically balanced class weights.
UltracoolSheet is available online at http://bit.ly/UltracoolSheet
Our analysis shows that in crowded regions unTimely epochal magnitudes are highly correlated with the fracflux parameter describing the fraction of the flux inside PSF footprint coming from the object itself. While regressing for it and then extrapolating to fracflux=1, i.e. fully uncrowded case, looks like proper routine to get unbiased object magnitude from unTimely data, direct comparison with CatWISE2020 shows that such estimates are significantly less stable and more biased than just mean values.
VO SED Analyzer is available online at http://svo2.cab.inta-csic.es/svo/theory/vosa/
“A Modern Mean Dwarf Stellar Color and Effective Temperature Sequence” version 2022.04.16 is available online at Eric Mamajek website at https://www.pas.rochester.edu/~emamajek/EEM_dwarf_UBVIJHK_colors_Teff.txt (Pecaut & Mamajek 2013).
All Tables
All Figures
|
Fig. 1 Examples of images used to visually check the moving object candidates selected by the algorithm described in Section 2.1. Each row displays the cutouts from the first and last epochs in unWISE coadds, and the corresponding differences between the images and median of all available epochs. All cutouts are centered on the position of the object from the first epoch (so that it is in the center in the first and third columns). Red dots mark the positions of the objects from all available epochs, with the larger circle corresponding to the current epoch of the image. The first and second rows display the actual moving objects, for isolated and crowded fields, while the third one shows an artifact due to a bright star spike, and the last a spurious candidate due to linking together individual detections of several stationary objects located roughly along the line. |
| In the text | |
|
Fig. 2 Progress of machine-learning-based classification of initial candidates, as is described in Section 2.1. Upper panel: number of visually vetted real moving objects and artifacts at each iteration, from the pool of 1 271 921 initial candidates. Lower panel: threshold probability corresponding to 100 previously unclassified candidates with the highest score produced by the random forest binary classifier trained at each iteration. These candidates are then visually checked and used to improve the classifier on the next iteration. The procedure stops when the threshold probability falls to zero (the classifier stops producing new candidates for visual inspection). |
| In the text | |
|
Fig. 3 Histograms of several features, defined in Table 1, for visually vetted real moving objects, visually vetted artifacts, and the other candidates rejected by the iterative machine learning classification described in Section 2.1. The other candidates never got a high score from the classifier, and their distribution is similar to the one of visually vetted artifacts. |
| In the text | |
|
Fig. 4 Upper panel: efficiency of the moving object detection algorithm, estimated as is described in Section 2.2 by either injecting simulated entries into unTimely epoch catalogs (only detection per se is characterized), or by comparing the results with the list of known ultracool dwarfs from UltracoolSheet (Best et al. 2024a) (both detection and machine-learning-based filtering are characterized) for different brightnesses in the WISE W2 band. As was expected, the majority of objects faster than ~0.3″/year are successfully detected, with a nearly 100% efficiency for the objects brighter than W2 < 15, and an expected slight performance loss for fainter ones due to the epochal unTimely detection limit being worse than the CatWISE2020 (Marocco et al. 2021) one. The algorithm is equally efficient for the objects moving as fast as 10″/year, and still has an expected efficiency of 82% at 20″/year. Lower panel: histogram of the W2 magnitude for known UltracoolSheet objects moving faster than 0.4″/year, and its subset detected here. |
| In the text | |
|
Fig. 5 Comparison of the proper motions measured in this work with values from Gaia DR3 (Gaia Collaboration 2023). The agreement with Gaia proper motions is sufficiently good, with the spread increasing toward smaller values as the track length in unTimely data becomes too small to permit accurate measurement. |
| In the text | |
|
Fig. 6 High-proper-motion objects detected in this work that do not have SIMBAD associations. Proper motions were estimated using both unTimely data and additional associations from several multiwavelength photometric catalogs. Effective temperatures are from the fit of these photometric data with the grid of BT-Settl (Allard 2014) model spectra, as is described in Section 2.3. Colored symbols represent known objects that we also detected and characterized, which have already been published in UltracoolSheet (Best et al. 2024a; Best et al. 2021, 2024b), Brooks et al. (2024), dal Ponte et al. (2023), or Burgasser et al. (2024b), and which thus are excluded from the final list. Vertical black vertical ticks at the bottom mark the proper motions of new objects that do not have enough multiwavelength associations for spectral fitting. The secondary vertical axis on the right shows the spectral types corresponding to the effective temperatures according to Pecaut & Mamajek (2013). Light gray points in the background show the Gaia DR3 stars within 100 pc with effective temperatures estimated using the GSP-Phot pipeline (Andrae et al. 2023). |
| In the text | |
|
Fig. 7 Positions of the new moving objects we detected (red circles with error bars) in infrared two-color and reduced J magnitude diagrams for the known ultracool dwarfs from UltracoolSheet (Best et al. 2024a). The colors of known objects correspond to their spectral class according to the color bars to the right of the plots. The blue points show spectroscopically confirmed T subdwarfs from Burgasser et al. (2024b) that we also detected. The black line marks the template colors of ultracool dwarfs according to dal Ponte et al. (2023). The vertical red ticks at the bottom of the left panel mark the WISE color of objects that do not have associated J band measurements. Purple points also mark the objects for which we did not get enough multiwavelength data for the VOSA spectral fit, but for which J band data are still available. Dashed black lines in the bottom right panel mark the criteria for the selection of candidate T subdwarfs in Burgasser et al. (2024b). |
| In the text | |
|
Fig. 8 Comparison between published spectral types for the objects that have neither SIMBAD nor Gaia associations but are present in either UltracoolSheet (Best et al. 2024a), Brooks et al. (2024) or Burgasser et al. (2024b), with our best estimates done using the VOSA spectral fit based on the BT-Settl model grid (circles), using the nearest UltracoolSheet neighbors in the two-color plots akin to Figure 7 (squares), or by using UltracoolSheet objects with similar W 1 – W2 colors (stars). The error bars correspond to the 96% (2σ) confidence limits of the corresponding estimations. Two significant outliers in the upper left corner are CWISE J220134.02-041609.5 and CWISE J230252.77-131458.0, which both have very large χ2 values in Brooks et al. (2024) indicating bad fits there, so we consider our late type estimations for them to be more correct. The VOSA effective temperatures for three objects from Burgasser et al. (2024b) agree well with the published values, while their spectral types are underestimated (green circles below the equality line) due to differences in the temperature to spectral type mapping for subdwarfs from the Pecaut & Mamajek (2013) ones that we used. |
| In the text | |
|
Fig. 9 Positions of the detected moving objects in Galactic coordinates, with the estimated spectral type represented by the marker color. The objects with no such estimates are colored in red. The ecliptic plane is shown with a dashed black line. |
| In the text | |
|
Fig. 10 Left panel: comparison of the Gaia DR3/DR2 distances for the moving objects lacking SIMBAD associations with photometric distances derived in Section 3. The distances estimated using interpolation of MW2 absolute magnitudes are in good agreement with astrometric ones for the objects colder than approximately an M3 spectral type, and are significantly overestimated for earlier types. Right panel: comparison of effective temperatures for the same objects estimated by Gaia DR3 GSP-Phot pipeline (Andrae et al. 2023), with the ones derived in this work using grid of BT-Settl model spectra implemented in VOSA (Bayo et al. 2008). The colors of the dots show the distances from Gaia DR3. The overall agreement between VOSA and GSP-Phot estimations is sufficiently good. Additionally, black stars represent the subdwarfs from Burgasser et al. (2024b) with effective temperatures derived from NIR spectra that overlap with our sample. Our estimated temperatures are also in good agreement with them. |
| In the text | |
|
Fig. 11 Distances and spectral types (left panel), and distances and projected velocities (right panel) for new moving objects discovered in this work (red points) in comparison to known ultracool dwarfs from UltracoolSheet (Best et al. 2024a) (blue points) and all 118 objects discovered by Brooks et al. (2024) (black stars). The distances for new objects were estimated by interpolating MW2 absolute magnitudes using nearby stars from the 20-pc census of Kirkpatrick et al. (2024), and then used for converting proper motions to projected velocities. The diagonal gray lines in the right panel correspond to fixed values of proper motion. |
| In the text | |
Current usage metrics show cumulative count of Article Views (full-text article views including HTML views, PDF and ePub downloads, according to the available data) and Abstracts Views on Vision4Press platform.
Data correspond to usage on the plateform after 2015. The current usage metrics is available 48-96 hours after online publication and is updated daily on week days.
Initial download of the metrics may take a while.