| Issue |
A&A
Volume 688, August 2024
|
|
|---|---|---|
| Article Number | A168 | |
| Number of page(s) | 10 | |
| Section | Catalogs and data | |
| DOI | https://doi.org/10.1051/0004-6361/202347368 | |
| Published online | 15 August 2024 | |
A sample of 554 white dwarfs showing infrared excess from Gaia EDR3 and CatWISE catalogs★
1
Departamento de Física de la Tierra y Astrofísica, Fac. CC. Físicas, Universidad Complutense de Madrid,
Plaza de las Ciencias, 1,
28040
Madrid,
Spain
e-mail: cmadurga@ucm.es
2
Department of Physics, University of Warwick,
Gibbet Hill Road,
Coventry
CV4 7AL,
UK
3
European Space Agency, Camino Bajo del Castillo,
s/n. Urb. Villafranca del Castillo,
28692
Villanueva de la Canada, Madrid,
Spain
4
Gemini Observatory/NSF’s NOIRLab,
670 N. A’ohoku Place,
Hilo,
HI
96720,
USA
5
Institute of Astronomy, University of Cambridge,
Madingley Rise,
Cambridge
CB3 0HA,
UK
Received:
5
July
2023
Accepted:
29
May
2024
Context. White dwarfs (WDs) are generally intrinsically faint in the infrared (IR). Excess emission in the infrared results from low-mass companions or dusty material, potentially linked to the on-going accretion of planetary material.
Aims. This work presents a new catalog of white dwarfs with (candidate) infrared excess.
Methods. The final sample comes from a cross-match between the Gaia Early Data Release (EDR3) white dwarf candidates, and the CatWISE catalog, with candidate infrared excesses determined considering both magnitude and color excess. A magnitude excess is found to be more reliable than a color excess.
Results. The final catalog contains 554 infrared excess candidates (446 are presented for the first time here) from 41 020 white-dwarf candidates with a Gaia magnitude of G < 18.5 mag. Our infrared excess candidate sample extends to a white-dwarf temperature range of 4500–98 000 K and a white-dwarf mass range of 0.1–1.2 M⊙. We caution that these objects should be treated as infrared excess candidates until confirmed with other methods.
Conclusions. We present a three-fold increase in the sample of white dwarfs known to have infrared excesses. Among the sample applications is the study of the accretion of planetary material by white dwarfs and the identification of new white-dwarf-brown-dwarf pairs.
Key words: catalogs / circumstellar matter / white dwarfs / infrared: stars
Full Tables 1 and 3 are available at the CDS via anonymous ftp to cdsarc.cds.unistra.fr (130.79.128.5) or via https://cdsarc.cds.unistra.fr/viz-bin/cat/J/A+A/688/A168
© The Authors 2024
 Open Access article, published by EDP Sciences, under the terms of the Creative Commons Attribution License (https://creativecommons.org/licenses/by/4.0), which permits unrestricted use, distribution, and reproduction in any medium, provided the original work is properly cited.
This article is published in open access under the Subscribe to Open model. Subscribe to A&A to support open access publication.
1 Introduction
Over the past decade, white dwarfs (WDs) have played an important role in the study of exoplanets, particularly in constraining their composition (Zuckerman et al. 2007; Klein et al. 2010). White dwarfs have pure hydrogen or helium-dominated atmospheres, as heavier elements sink quickly due to the high surface gravity (log g ≈ 8 cm s−2)1. In other cases, some white dwarfs show traces of heavier elements (metals) due to the accretion of disrupted extrasolar minor planets, or companions (Jura 2003). Such “polluted” white dwarfs provide the bulk elemental abundances of planetary building blocks. These systems are perfect for studying the formation and evolution of planets, as well as the potential habitability of other worlds (Kaltenegger et al. 2020; Xu & Bonsor 2021). The most heavily “polluted” white dwarfs often have a debris disk (e.g., Xu et al. 2019). Evidence of debris around white dwarfs is provided by the infrared (IR) excess in their spectrum, which indicates the presence of a cooler object or dust (Zuckerman & Becklin 1987).
The common assumption is that these debris disks are remnants of extrasolar or minor planets that were destroyed within the tidal radius of the white dwarf (Debes & Sigurdsson 2002; Gänsicke et al. 2012; Bergfors et al. 2014; Farihi 2016). The debris disks eventually accrete onto the white dwarf and would cause pollution of the photospheres of the white dwarfs (Jura 2003; Harrison et al. 2018; Putirka & Xu 2021). Spectroscopic observations of “polluted” white dwarfs can be used to measure the chemical composition of the extrasolar planetary material (e.g., Xu et al. 2019).
White dwarfs are the perfect candidates to search for infrared emission from dust, as they are intrinsically faint in the infrared. With their relatively high temperatures, most of their emission is in the ultraviolet or the optical. Dusty white dwarfs have been found with cooling ages between 30 Myr and 1 Gyr, with temperatures decreasing from 34 000 to 8000 K (Lai et al. 2021). For both the hottest and coolest white dwarfs, conditions are thought to prevent the presence of dust disks. For the hot white dwarfs, dust inside the tidal radius would sublimate (von Hippel et al. 2007). Around cool white dwarfs, dust disks might be too faint to be detected (Xu & Jura 2012). However, pollution is common around these stars, and the question as to what dynamical mechanisms that lead to white dwarf pollution can continue functioning for such a long time (Gigayear timescale) at such temperatures remains unanswered (Debes et al. 2012). Nevertheless, some dust disks have been found around white dwarfs outside this temperature range (Chu et al. 2009; Bilikova 2012; Su et al. 2013; Debes et al. 2019; Shestakova et al. 2022; Blouin & Xu 2022; Hollands et al. 2017, 2018).
White dwarfs with low-mass companions in the brown-dwarf regime will also have an IR excess. Such binaries are rare (0.1–0.5%; Girven et al. 2011); however, these binaries are especially valuable for studying the properties of brown dwarfs. The total age of the binary can be obtained by the cooling age of the white dwarf plus its main sequence life time (Kiman et al. 2022), and it can be used to calculate the physical properties of the brown dwarfs (Fontaine et al. 2001). However, it is important to consider the evolution of the system. Wide resolved binaries are unlikely to suffer effects from the companion during their evolution and will have evolved as single stars. In the case of close systems, the common envelope stage may have disturbed the evolution of each component (French et al. 2023).
The spectral energy distribution in the 1–5 μm range of dusty white dwarfs appears to be very similar to those with low-mass companions. However, Lai et al. (2021) proposed a method to distinguish both cases with high-precision J-band photometry. Low-mass companions, including M dwarfs, have a wider range of temperatures and therefore a greater range of wavelengths in which infrared excess is shown. On the contrary, dust disks are not expected to show excess in the near-infrared J band. This characteristic helps to determine whether the excess comes from a dust disk or not.
The advent of modern all-sky surveys renders the search for white dwarfs with infrared excess effective and can provide candidates for follow-up work. Similar efforts have been pursued in the past (Hoard et al. 2007, 2013; Debes et al. 2011; Xu et al. 2020; Lai et al. 2021; Wang et al. 2023) and are briefly described in Sec. 2. Here, we carried out a similar search taking advantage of data from two new catalogs: (1) new white dwarf candidates from the Early Data Release 3 (EDR3) of Global Astrometric Interferometer for Astrophysics (Gaia; Gentile Fusillo et al. 2021); and (2) the CatWISE catalog (Marocco et al. 2021) of infrared sources based on the Wide-field Infrared Survey Explorer (WISE). WISE photometry is crucial for identifying white dwarfs with infrared excesses from dust disks, because the first two WISE bands are where the disk flux peaks (Wang et al. 2014; Swan et al. 2019). Furthermore, WISE is sensitive enough to observe a significant portion of the bright end of the Gaia white-dwarf population.
We summarize the previous work in Sec. 2, highlighting possible improvements. In Sec. 3, we describe our selection criteria used to define an infrared excess. We discuss the final sample and its properties in Sec. 4 and provide some conclusions in Sec. 5.
Bright white dwarfs (G ≤ 17 mag) confirmed to have infrared excess.
2 Previous work
After the first discovery of a debris disk around the white dwarf G 29–38 (Graham et al. 1990; Zuckerman & Becklin 1987), the two micron all sky survey (2MASS) was used to search for infrared excesses around white dwarfs (Hoard et al. 2007) at wavelengths shorter than 2.4 μm, without access to longer wavelengths.
2.1 Spitzer-confirmed known WDs with IR excess
The first systematic identification of cool infrared excess around white dwarfs became possible after the launch of the Spitzer Space Telescope (Mullally et al. 2007). Several studies have increased the number of Spitzer-confirmed white dwarfs, (Farihi et al. 2010; Barber et al. 2016; Dennihy et al. 2020; Melis et al. 2020; Lai et al. 2021; all of them are specified in Sect. 1). A total of 107 white dwarfs (with G ≤ 17 mag) with an infrared excess have been identified so far. This modest sample extends over a wide range of space parameters, with a temperature range from 7300 to 34000 K and a mass range from 0.3 to 1.2 solar mass (Table 1). Fourteen of them are more likely to have a companion than a disk. For ten, the companion is probably an M dwarf (they have a J-band excess), and the other four are known brown dwarfs. The remaining 93 are known dusty white dwarfs (Lai et al. 2021).
The Spitzer sources are important for this work, as objects detected from the WISE survey (see below) can only be considered candidates, due to the large beam size of WISE (i.e., occasional contamination by nearby infrared-bright objects is possible (Dennihy et al. 2020)). In Sect. 4.2, we discuss the Spitzer-confirmed sources found in our work.
2.2 Previous work based on Gaia and WISE
Prior to our work, a number of WISE catalogs have been used to search for infrared excesses around white dwarfs (Hoard et al. 2013; Dennihy et al. 2017; Rebassa-Mansergas et al. 2019). One of the latest used the Gaia DR2-based white-dwarf catalog (Gentile Fusillo et al. 2019) matched with the unWISE catalog (Xu et al. 2020). It produced a set of 188 high-confidence white dwarfs showing infrared excess. These candidates were identified from an initial sample of 6002 Gaia white dwarf candidates with G ≤ 17 mag. 188 showed an infrared excess via either a magnitude excess or a color excess. 147 of them were new discoveries, with an order of magnitude increase compared to previously known dusty white dwarfs. However, due to the large beam size of WISE, background confusion is unavoidable (Dennihy et al. 2020). This sample was followed up using the Spitzer Space Telescope to reveal that 80% of the candidate IR excesses are associated with the target rather than background sources (Lai et al. 2021). Taking advantage of the improvements in the catalogs with the arrival of Gaia EDR3 and CatWISE2020, this work aims to augment the catalog of white dwarfs with IR excess using similar techniques.
3 Selection criteria for white dwarfs with IR excess
3.1 Differences between unWISE and CatWISE; Gaia DR2 and EDR3
The number of white-dwarf candidates has significantly increased with Gaia EDR3 compared to Gaia DR2. Gentile Fusillo et al. (2019) identified 262 480 high-confidence white dwarfs from Gaia DR2. Of those, 247 525 are identified again in the new EDR3 catalog (Gentile Fusillo et al. 2021)2. The EDR3 catalog contains a total of 359 073 high-confidence white-dwarf candidates, that is 111 548 new ones compared to DR2. Most of the new candidates have magnitudes between G = 19 and G = 20 mag. The brightest white dwarfs already had reliable photometric data in DR2. The interest of repeating the study with the newer versions of the Gaia and WISE catalogs was to push the magnitude limit of the sample from G = 17.0 to G = 18.5. The Gaia EDR3 white-dwarf candidate catalog contains 41 020 sources with G < 18.5 mag, while the Gaia DR2 white-dwarf candidate catalog contained only 38 117 sources.
The increase in new white dwarf candidates is particularly evident in crowded areas of the sky. The measurements have improved and have allowed many of the strict limitations that were imposed in DR2 in these dense regions of the sky to be removed. However, even with the improvements, the catalog remains incomplete in the central part of the Galactic plane (Gentile Fusillo et al. 2021).
The WISE mission mapped the entire sky simultaneously in four infrared bands centered at 3.4, 4.6, 12, and 22 μm (denoted W1, W2, W3, and W4, respectively; Wright et al. 2010). In 2013, the data release called ALLWISE was based on co-adding the two dozen exposures per position from the initial year of WISE surveying, and building a catalog of source fluxes and positions from these exposures (Cutri et al. 2021). Later, a new data release called the unWISE catalog (Schlafly et al. 2020) was made available; it combines the 2010 and 2011 data used for ALLWISE with the 2013–2016 NEOWISE data. The unWISE uses a crowded-field point-source photometry code called crowdsource, which improves the reliability of photometry, especially in crowed regions. For faint targets (W1, W2 > 16 mag), the unWISE values and uncertainties have a much smaller scatter compared to ALLWISE, particularly in the longer W2 filter. Despite the clear advantages of unWISE over ALLWISE, unWISE is a static-sky catalog; that is, it does not account for the proper motion of the sources.
In order to remedy this shortcoming, the CatWISE catalog was created (Marocco et al. 2021). It combines sources from WISE and NEOWISE, selected simultaneously in both W1 and W2 bands, and provides proper-motion estimates. It adapted the ALLWISE software to measure the sources in co-added images created by the unWISE team from six-month subsets, each representing one coverage of the inertial sky or epoch. For the CatWISE Preliminary Catalog (Eisenhardt et al. 2020), data for sources were collected between 2010 and 2016. This includes four times as many exposures and spans over ten times the timeline of ALLWISE. The total time spanned by CatWISE epochs at a given inertial position is over 6 yr, compared to a typical value of six months for ALLWISE. Thus, the CatWISE motion estimates are far more accurate. As one caveat, the number of sources per square degree in CatWISE shows little variation over the sky. While the method followed for the sources’ detection is optimal for isolated objects, it results in incompleteness for high-source-density regions. The CatWISE2020 catalog addresses this issue thanks to an improvement in the updated version of the unWISE catalog. It includes two more years, increasing the number of epochs to 12 and the time span to over 8 yr, and the number of sources to more than twice that of the CatWISE Preliminary Catalog.
3.2 Initial white-dwarf sample
Seeking to increase the sample of white dwarfs with infrared excess and taking advantage of the improved CatWISE2020 catalog, this work respects a Gaia magnitude limit of G < 18.5 mag. This means that this work starts with a larger number of sources, which are then reduced step by step following selection criteria (see next section), avoiding the elimination of a large number of potentially interesting sources directly. For our initial sample, we applied the white dwarf probability as defined in Gentile Fusillo et al. (2021) as PWD > 0.75. Our initial sample contains 41 020 high-probability white dwarf candidates around which we search for infrared excess.
3.3 Selection criteria
Inspired by Xu et al. (2020), we developed five steps, described below in detail, to select infrared-excess candidates (see also Fig. 1). The initial set of sources is Sample A (described in Sec. 3.2), with 41 020 high-confidence white-dwarf candidates.
3.3.1 Cross-correlate with CatWISE2020
The first step was to cross-match (via coordinates) the objects in Gaia EDR3 Sample A with the CatWISE2020 catalog. To do so, a coordinate transformation was carried out in Gaia EDR3 to have the same epoch in both catalogs, using Gaia proper motions. Gaia EDR3 coordinates (right ascension and declination) are given in the JD2016 epoch, and CatWISE2020 catalog coordinates in the JD2000 epoch. The JD2000 epoch was chosen for our analysis.
For the cross-matching, we used the tool TOPCAT (Taylor 2005). A matching radius of 3″ was selected to maximize the number of stars converging at this value and to cover the entire WISE beam of 6″. We obtained 23 914 matches.
We checked the signal-to-noise ratio (S/N) of both W1 and W2 magnitude data in the sample obtained from the cross-match. The S/N decreases significantly at the faint end of our sample. We decided to set a lower limit of five for the S/N. In the W1 band, only 133 white dwarfs were rejected due to the low S/N. In the W2 band, the clear limiting measurement, 11 906 white dwarfs were rejected. Eventually, we found 11980 white dwarfs with a S/N > 5 in both the W1 and W2 bands (our Sample B).
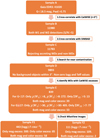 |
Fig. 1 Flowchart showing the five steps of our selection of infrared excess candidates. |
3.3.2 Cross-correlation with SIMBAD
Some of the sources could be accreting white dwarfs in a binary system, or these may not even be white dwarfs – both of which we wanted to exclude. This can be done by looking at their spectral type (when it is known). We cross-correlated Sample B with the SIMBAD database (Egret et al. 1991). From the 11980 white dwarfs of Sample B, 11659 are cataloged in SIMBAD. Among them, 3532 have a spectral type listed. The majority are white dwarfs, but 197 are rejected from our study because the spectral type does not correspond to an isolated white dwarf. We removed these objects even though some spectral types can be erroneous. The rest of the sources do not have a confirmed spectral type or do not appear in SIMBAD, and therefore they cannot be reliably assessed and were kept in this step.
Our final sample after this step (Sample C) was composed of the 3335 confirmed white dwarfs by their spectral type, the 8127 sources cross-matched with SIMBAD but without a confirmed spectral type, and the 321 sources that do not appear on SIMBAD. The total number of sources remaining after Step 3 was 11783 (Sample C).
3.3.3 Search for background contamination
As mentioned above, WISE has a beam size of 6″, which is much larger than the Gaia resolution (on the order of milliarcseconds). The matching by coordinates that we performed between the two catalogs would not be able to detect a false-positive infrared excess due to a background source within the WISE beam (i.e., within 3″ of the Gaia white dwarf).
To exclude such contamination, we cross-matched the WISE coordinates of Sample C with the entire (not just white dwarfs) Gaia EDR3 catalog. Hence, we verified whether more than one Gaia source (i.e., potential an infrared emitter) lay within 3″ of the WISE coordinates. We found two or more Gaia sources within the WISE beam in 1740 cases. These were excluded from Sample C as potentially contaminated infrared sources.
Additionally, we excluded 111 sources lacking effective temperature and log g values in the Gaia catalog. As these values are required for the next selection step, these sources were removed. This left a final sample of 9893 white dwarfs (Sample D) to be checked for a potential infrared excess.
3.3.4 Identify white dwarfs with infrared excess
The last step was to identify, in Sample D, the white dwarfs that show infrared excess (i.e., that potentially host a debris disk ora companion). As a benchmark for the expected infrared flux in the absence of an excess, we used model fluxes for uncontaminated white dwarfs: pure-hydrogen white-dwarf model atmospheres from Holberg & Bergeron (2006)3. We used the model, providing W1 and W2 absolute magnitude values as a function of a grid of effective temperature, surface gravity, and parallax values. We then interpolated the model fluxes using the Gaia Teff and log(g) values for the individual candidates in our sample (Gentile Fusillo et al. 2021). We note that the uncertainties in Teff and log(g) are small enough not to play a role in our infrared excess error budget. We computed the apparent W1 and W2 model magnitudes (mmod,i) and compared them with the actual observed magnitudes, the difference being interpreted as infrared excess. The uncertainties on the measurements of W1 and W2 magnitude, dominated by the errors in the WISE photometry, are taken into account as described below.
We adopted two measures for an infrared excess: the magnitude excess (in W1 and/or W2) and the (W1–W2) color excess. For a given wavelength, the magnitude excess is χ(i):
![$\[\chi(i)=\frac{m_{\mathrm{mod}, i}-m_{\mathrm{obs}, i}}{\sqrt{\sigma_{\mathrm{mod}, i}^2+\sigma_{\mathrm{obs}, i}^2}},\]$](/articles/aa/full_html/2024/08/aa47368-23/aa47368-23-eq1.png) (1)
(1)
with i = W1 or W2. σmod,i is the model uncertainty, assumed to be 5% of the model flux. mobs,i is the measured W1 and W2 magnitude from WISE. σobs,i is the uncertainty also given by WISE measurements. mmod,i is the predicted WISE magnitude from the model of white dwarfs. The (W1–W2) color excess is characterized by ∑W12:
![$\[\Sigma_{\mathrm{W} 12}=\frac{m_{\mathrm{obs}, \mathrm{W} 1}-m_{\mathrm{obs}, \mathrm{W} 2}-\left(m_{\mathrm{mod}, \mathrm{W} 1}-m_{\mathrm{mod}, \mathrm{W} 2}\right)}{\sqrt{\sigma_{\mathrm{obs}, \mathrm{W} 1}^2+\sigma_{\mathrm{obs}, \mathrm{W} 2}^2+\sigma_{\mathrm{mod}, \mathrm{W} 1}^2+\sigma_{\mathrm{mod}, \mathrm{W} 2}^2}}.\]$](/articles/aa/full_html/2024/08/aa47368-23/aa47368-23-eq2.png) (2)
(2)
In order to define criteria for which values represent an “excess”, we analyzed the magnitude and color-excess distributions (χ(i) for both W1 and W2, and ∑W12). We considered two groups of sources, according to their G mag (sources with G < 17 mag and 17 ≤ G < 18.5), the second (fainter) one being largely dominated by errors in the WISE photometry. For each group, we calculated the median and standard deviation4 of the magnitude excess (for W1 and W2) and the color excess, not considering the upper and lower 10% values of χ(i) and ∑W12 to avoid them being dominated by extreme outliers. Due to the considerable difference between W1 and W2 in the quality of the photometry, we decided to define one magnitude excess criterion for each subgroup. Table 2 collects the values.
Positive values indicate that the model magnitude is fainter than the observed one; that is, the observed one shows an excess. We set the criteria for a white dwarf to have an infrared excess when both χ(W1) > 8 and χ(W2) > 8 for G < 17 mag and χ(W1) > 30 and χ(W2) > 30 for 17 ≤ G < 18.5 mag. In our sample, 749 white dwarf candidates showed an infrared excess using these criteria.
Looking at the color excess, positive color means that the flux in the W2 band is higher than the flux in the W1 band. Then, positive color-excess values mean that the difference between the observed colors is larger than the difference between modeled colors. In other words, a greater ∑W12 value means stronger infrared excess. We defined an infrared color excess as ∑W12 > 5 for G < 17 mag and ∑W12 > 7 for 17 ≤ G < 18.5 mag. We found 162 white-dwarf candidates in our sample showing a color excess.
Looking simultaneously at infrared excess and infrared color excess, we found 72 sources in our sample. Our final Sample E contained 839 sources: 677 with only a magnitude excess, 90 with only a color excess, and 72 with both magnitude and color excess.
Figure 2 plots W1 and W2 magnitudes as a function of the infrared magnitude and color excess. Sample D sources are shown in two groups (for G < 17 mag in the three upper panels, and 17 ≤ G < 18.5 mag in the three lower panels). Our final infrared-excess candidates are shown in light blue and black, while most sources (shown in purple) are statistically compatible with a magnitude/color excess around zero; that is, compatible with predicted model fluxes for white dwarfs without excess. This confirms a) that the infrared fluxes of the models match the fluxes of a large sample of observed white dwarfs, and b) that white dwarfs with a statistically significant infrared excess are uncommon objects, while still representing on the order of 10% of our Sample D.
Median and standard deviation of the magnitude and color-excess methods from Sample D.
3.3.5 Check WiseView images for contamination
Our final step was to make an additional check for background contamination. In Step 3, we based our criteria entirely on an optical catalog (Gaia EDR3), removing background sources found inside the matching radius selected (3 arcsec). Bright infrared background sources, either too faint to be detected in the optical or outside the matching radius, might still contaminate our targets. To identify the possible contaminated sources, we used the WiseView tool (Caselden et al. 2018), allowing us to check the WISE images manually and to identify possible background contamination. We visually checked 839 sources from Sample E, and we eliminated the ones that appeared to be blended or located in very crowed fields (making it very difficult to assess the origin of the infrared excess). We found 285 sources for which the infrared excess cannot be associated with the white dwarf with full certainty – these are listed in our table as “Contaminated”. Our final Sample F contained 554 objects that we qualified as candidate white dwarfs with infrared excess.
We note that in Sample F, we still included white dwarfs with very low surface gravity (log g < 7) cm s−2, which are potentially unresolved binaries (i.e., double white dwarfs or white dwarf – main sequence binaries). Following our intention to assemble a high-confidence sample, we subdivided the final sample into Sample F1 (with log g ≥ 7 cm s−2) and Sample F2 (with log g < 7)5. Of the 554 sources of Sample F, 443 belong to Sample F1, these are likely to be dusty white dwarfs or white dwarfs with a companion. While our selection steps were thorough, we remind the reader that objects in our Sample F must be treated as candidates, as faint infrared background contamination cannot be excluded with a 100% success rate (Dennihy et al. 2020).
In summary, our final Sample F contains 554 white dwarfs with infrared excess. 409 of these only have a magnitude excess, 85 only have a color excess, and 60 have both magnitude and color excesses (Table 3).
3.4 Magnitude and color excess
Both magnitude and color excesses are frequently used to identify white dwarfs with infrared excess (Kennedy et al. 2012; Wilson et al. 2019; Xu et al. 2020). The magnitude excess requires the measured flux in the infrared to be above predictions for the white dwarf photosphere. This criterion strongly depends on the white dwarf atmosphere models, the flux calibrations of the observations, and the accuracy of the computed distance.
The color excess requires the infrared luminosity of the object to be brighter in the W2 than the W1 band and has the advantage of being a measurement independent of the distance. However, WISE is less sensitive in the W2 than in the W1 band, eventually leading to unreliable results for the color at fainter magnitudes.
Gaia delivers very reliable distances for our entire sample down to our magnitude limit, and the color excess relies on finding a higher W2 magnitude value to identify the source. In our case, sources with both magnitude and color excesses are most reliably identified.
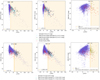 |
Fig. 2 W1 and W2 mag values as a function of their magnitude and color excess in Sample D. Sample D is divided into white dwarfs with G < 17 (first row) and with 17 ≤ G < 18.5 (second row). Spitzer-confirmed dusty white dwarfs and white dwarf-main sequence or M dwarf pairs (red); and white dwarfs with brown dwarfs companion (green) are represented. The orange line is the cut chosen to consider IR excess beyond it. The numbers next to the line are the number of sources we found on each side. We note that the IR excess distributions are non-normal and that the limit of three standard deviations from the median typically leaves us with 10% of the sample. |
4 Discussion
4.1 Final sample
The final high-confidence sample of white-dwarf candidates with infrared excess (hereafter “WD-IR candidates”) contains 554 sources, which is 1.4% of the initial Sample A. The frequency of infrared excess around white dwarfs in our work is 554/9893 ≈ 6%. The positions on the Gaia Hertzsprung-Russell (HR) diagram of the WD-IR candidates are shown in Fig. 3. The majority of the sources (Sample F1, pink) are located on the white dwarf main sequence, in a similar manner to the Spitzer-confirmed white dwarfs with infrared excess (black, green). On the other hand, sources with log g < 7 cms−2 (Sample F2, turquoise) lie outside this white dwarf main sequence. As mentioned above, these 111 sources are likely to be binaries.
4.2 Identification of the Spitzer-confirmed white dwarfs with infrared excess in the final sample
With our selection criteria, we found 58 out of the 107 Spitzer-confirmed white dwarfs to have an infrared excess (these 107 include 93 with debris disks and 14 white dwarf-brown dwarf or M dwarf or main sequence pairs). Twenty-two of our detected sources have both magnitude and color excesses that are under our criteria, 35 only have magnitude excess, and one only has color excess, as shown in Table 4. Seven Spitzer-confirmed infrared excess white dwarfs do not have catWISE photometry. Thus, this work finds 58/97=59.8% of the previously identified infrared excesses. The remaining 39 objects present in the Spitzer sample were missed in our study, mostly because they do not fulfill our stringent infrared excess criteria (29 sources); the remaining ones were missed due to a low S/N in the W2 band (1), being a confirmed hot subdwarf by SIMBAD (1), likely background contamination (7), and contamination seen in the WiseView images (1).
This demonstrates that for individual objects, Spitzer is able to identify infrared emission at significantly fainter levels than when using WISE, as in this study. Using the WISE survey has the advantage of being able to assemble a much larger sample of infrared excess candidates. The comparison also shows that our criteria for including objects in our final infrared excess sample are rather conservative and only include the Spitzer-confirmed candidates with the strongest infrared excesses.
Sample D, specifying those sources with infrared excesses (Sample F), as well as the contaminated sources (the ones excluded in the step from Sample E to Sample F).
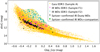 |
Fig. 3 Gaia HR diagram of white dwarfs from initial Sample A (yellow) and final Sample F (pink). |
Summary of the Spitzer-confirmed white dwarfs with an infrared excess as identified by this work.
4.3 Comparison with the previous WISE searches
Two studies before this one searched for white dwarfs with infrared excess using the WISE catalog. Barber et al. (2014; following up on 16 sources of a study that found 52 candidates using SDSS DR7 for the optical part) found the frequency of white dwarfs with infrared excess to be 3–4% using Spitzer, which is slightly lower than what is presented in our work (≈6%, which is comparable to 6.6% from Xu et al. (2020)). We believe that this difference can be explained by their smaller sample size and their stringent attempt to exclude false-positives.
Using unWISE and Gaia DR2, Xu et al. (2020) reported 188 white dwarfs with infrared excess, with a frequency of 188/2847 ≈ 7%, which is similar to our findings. In Fig. 4, we compare the number of white dwarfs with infrared excess found in their study and in this work, as a function of their W1 and W2 magnitude. First, we note that using the more recent versions of the WISE and Gaia catalogs as in this study, the sample is increased by a factor of about three (see yellow vs. pink histogram). The two samples overlap, and we recovered 106 of the 188 infrared excess candidates identified by Xu et al. (2020); that is, 106/188=56%. All 188 sources are found in our initial Sample A, but 82 were eliminated in our selection steps as detailed in Table 5.
Most of the sources (56 of 82) are discarded when applying our infrared excess criteria (from our Samples D to E). We compared the parameters used for each white dwarf for the infrared excess calculation in Xu et al. (2020) and in our work: effective temperature, log g, parallax, W1, W2, and the uncertainties of W1 and W2. All the values are (as expected) very similar (whether using Gaia DR2 or DR3; CatWISE or unWISE), except for the quoted uncertainties in W1 and W2. CatWISE uncertainties are smaller than the ones reported in unWISE for almost all of the sources. A smaller uncertainty implies computing greater magnitude excess and color excess values and, accordingly, greater derived median and standard deviation. Consequently, the infrared excess limit used as selection criteria changed between the two studies. Xu et al. (2020) considered a white dwarf to have infrared excess if χ(W1) > 5, χ(W2) > 5 and ∑W12 > 3, while we incremented in this study these numbers to χ(W1) > 8, χ(W2) > 8 for G < 17 mag and χ(W1) > 30, χ(W2) > 30 for 17 ≤ G < 18.5 mag; and ∑W12 > 5 for G < 17 mag and ∑W12 > 7 for 17 ≤ G < 18.5 mag.
Eventually, while following very similar methodologies in the two studies, the reduced uncertainties in the CatWISE catalog compared to unWISE led us to re-evaluate the exact limits above which we considered a source to have an infrared excess with high confidence. The sample presented in this work used more stringent criteria than Xu et al. (2020) and only includes their strongest infrared excess candidates.
We also compare the number of matches found between infrared excess candidates (Samples E DR2 and F EDR3) depending on the infrared excess methods (Table 6). Color excess does not recover the sources well, but this is consistent with the fact that this method is not as useful due to the uncertainties of the W2 band. For the magnitude method, we confirm our work has a relatively high success rate and that both works are consistent.
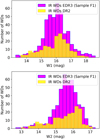 |
Fig. 4 Comparison of the number of the infrared excess candidates found in this study (Sample F1, pink) and in (Xu et al. 2020; using the Gaia DR2 and unWISE catalogs – in yellow) as a function of their W1 (upper panel) and W2 (lower panel) magnitudes. |
Summary of the number of infrared excess candidates (Sample E) in Gaia DR2 from Xu et al. (2020) that are found in each sample of our work.
Summary of the number of white-dwarf infrared-excess candidates (Sample E) from Xu et al. (2020) that are recovered in this work as a function of the method used (magnitude excess, color excess, or both).
4.4 Properties of the infrared-excess candidates
Finally, we assessed the temperature and mass of the 443 white dwarfs with infrared excess with log g ≥ 7 cm s−2. The upper plot of Fig. 5 shows that white dwarfs have a mean temperature on the order of 10 000 K. For the coolest white dwarfs, we found 89 (out of 443) sources with temperatures lower than 10 000 K, in comparison with the 21 (out of the 1252) found in Xu et al. (2020), and we confirm that there are fewer dust disks around cooler white dwarfs, as found previously. For the hottest white dwarfs (>30 000 K), the number of candidates has tripled with our work compared to previous work Xu et al. (2020). The hottest Spitzer-confirmed white dwarf with infrared excess has a temperature of around 34000 K (Lai et al. 2021). We found 26 sources with a temperature higher than this limit. However, dust around these hot white dwarfs cannot reside within the tidal disruption radius due to the high levels of stellar irradiation leading to sublimation. Instead, this dust must reside further from the star, posing questions as to whether these objects represent a different, exciting set of dusty objects (Farihi et al. 2014; Bonsor & Wyatt 2010).
The bottom panel of Fig. 5 shows a histogram of the WD masses, indicating that there is no apparent trend with white-dwarf mass. Moreover, we checked that the population with and without IR excesses are consistent and that they follow the same distribution, with a few objects having small and large masses, and most of the candidates having an intermediate mass around 0.6 solar masses. Below around 0.3 solar masses, white dwarfs are called extremely low-mass (ELM) white dwarfs. We found 24 infrared excess candidates of this type, which is unexpected and very unusual. These white dwarfs are likely the result of binary processes, including envelope stripping (Sarna et al. 2000). The infrared excesses likely have a different origin to the main population, highlighting evolutionary processes related to binarity.
5 Conclusions
This work presents a catalog of 554 high-confidence white dwarfs with infrared excess. The catalog was created by cross-matching the Gaia EDR3 white-dwarf catalog (with magnitude limit of G < 18.5 mag) and the CatWISE infrared catalog. Successive selection criteria were applied to exclude sources in which the infrared excess is not reliably associated with the white dwarf star. Improvements to the reliability of CatWISE over the previous WISE catalogs made this work possible, as good quality infrared measurements were essential to this study.
Pure-hydrogen white-dwarf model atmospheres were used to identify excess emission in the infrared. Both color and magnitude excess were used to identify excess emission. Due to the rapidly decreasing photometric quality in the W2 band as sources become fainter, magnitude excesses are deemed to be more reliable than color excesses.
In our final sample, 443 of the 554 objects have a log g ≥ 7 cm s−2, representing a subsample with a low probability of containing unresolved white-dwarf binaries. Of these, 300 show only a magnitude excess, 85 show only a color excess, and 58 show both magnitude and color excesses. These white dwarfs with excess infrared emission are good candidates for accreting planetary debris. This work provides a significant (a factor ≈ 3) increase in the number of dusty white-dwarf candidates potentially suited for a follow-up investigation of their planet composition. Although from this study alone, we cannot determine whether these objects show infrared excess because of dust disks or low-mass companions; moreover, some cases of faint background contamination cannot be fully excluded either.
The work presented here was aimed at identifying “high-confidence” candidates, and we therefore remained conservative in our identification of excess infrared emission. 59.6% of the Spitzer-confirmed white dwarfs with infrared excess were identified, as were 56% of the sources found in Xu et al. (2020) using Gaia DR2 and unWISE. The remaining Spitzer-confirmed white dwarfs are likely intrinsically too faint to be seen in CatWISE.
This new catalog of white dwarfs with infrared excess has many potential applications, including the study of the accretion of planetary material by white dwarfs and the identification of new white-dwarf-brown-dwarf pairs. White dwarfs that have accreted planetary material provide key information regarding exoplanetary composition and bring us closer to the detection of life beyond the Solar System.
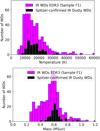 |
Fig. 5 Comparison of final infrared excess EDR3 candidates from our work (Sample F1, pink) and Spitzer-confirmed dusty white dwarfs (black) depending on their temperature and mass. |
Acknowledgements
We would like to thank P. Bergeron for the white dwarf model calculations. We also thank the anonymous referee for their thoughtful comments that greatly helped to improve the paper. This work has made use of data from the European Space Agency (ESA) mission Gaia (https://www.cosmos.esa.int/gaia), processed by the Gaia Data Processing and Analysis Consortium (DPAC, https://www.cosmos.esa.int/web/gaia/dpac/consortium). Funding for the DPAC has been provided by national institutions, in particular the institutions participating in the Gaia Multilateral Agreement. This publication makes use of data products from the Wide-field Infrared Survey Explorer, which is a joint project of the University of California, Los Angeles, and the Jet Propulsion Laboratory/California Institute of Technology, funded by the National Aeronautics and Space Administration. This work is also based in part on observations made with the Spitzer Space Telescope, which was operated by the Jet Propulsion Laboratory, California Institute of Technology under a contract with NASA. S.X. is supported by the international Gemini Observatory, a program of NSF’s NOIRLab, which is managed by the Association of Universities for Research in Astronomy (AURA) under a cooperative agreement with the National Science Foundation, on behalf of the Gemini partnership of Argentina, Brazil, Canada, Chile, the Republic of Korea, and the United States of America. A.B. acknowledges support of a Royal Society University Research Fellowship, URF\R1\211421. Software: Astropy (Astropy Collaboration 2013), Matplotlib (Hunter 2007), Scipy (Virtanen et al. 2020), Pandas (pandas development team 2023), TOPCAT (Taylor 2005).
References
- Astropy Collaboration (Robitaille, T. P., et al.) 2013, A&A, 558, A33 [NASA ADS] [CrossRef] [EDP Sciences] [Google Scholar]
- Barber, S. D., Kilic, M., Brown, W. R., & Gianninas, A. 2014, ApJ, 786, 77 [NASA ADS] [CrossRef] [Google Scholar]
- Barber, S. D., Belardi, C., Kilic, M., & Gianninas, A. 2016, MNRAS, 459, 1415 [NASA ADS] [CrossRef] [Google Scholar]
- Bergfors, C., Farihi, J., Dufour, P., & Rocchetto, M. 2014, MNRAS, 444, 2147 [CrossRef] [Google Scholar]
- Bilikova, J. 2012, PhD thesis, University of Illinois, Urbana-Champaign, USA [Google Scholar]
- Blouin, S., & Xu, S. 2022, MNRAS, 510, 1059 [Google Scholar]
- Bonsor, A., & Wyatt, M. C. 2010, in 17th European White Dwarf Workshop, eds. K. Werner, & T. Rauch, AIP Conf. Ser., 1273, 482 [NASA ADS] [Google Scholar]
- Caselden, D., Westin, P. I., Meisner, A., Kuchner, M., & Colin, G. 2018, Wise-View: Visualizing motion and variability of faint WISE sources, Astrophysics Source Code Library, [record ascl:1806.004] [Google Scholar]
- Chu, Y.-H., Su, K., Gruendl, R., et al. 2009, in AAS Meeting Abstracts, 214, 309.03 [NASA ADS] [Google Scholar]
- Cutri, R. M., Wright, E. L., Conrow, T., et al. 2021, VizieR Online Data Catalog, II/328 [Google Scholar]
- Debes, J. H., & Sigurdsson, S. 2002, ApJ, 572, 556 [NASA ADS] [CrossRef] [Google Scholar]
- Debes, J. H., Hoard, D. W., Wachter, S., Leisawitz, D. T., & Cohen, M. 2011, ApJS, 197, 38 [NASA ADS] [CrossRef] [Google Scholar]
- Debes, J. H., Walsh, K. J., & Stark, C. 2012, ApJ, 747, 148 [NASA ADS] [CrossRef] [Google Scholar]
- Debes, J. H., Thévenot, M., Kuchner, M. J., et al. 2019, ApJ, 872, L25 [NASA ADS] [CrossRef] [Google Scholar]
- Dennihy, E., Clemens, J. C., Debes, J. H., et al. 2017, ApJ, 849, 77 [NASA ADS] [CrossRef] [Google Scholar]
- Dennihy, E., Farihi, J., Gentile Fusillo, N. P., & Debes, J. H. 2020, ApJ, 891, 97 [CrossRef] [Google Scholar]
- Egret, D., Wenger, M., & Dubois, P. 1991, in Databases and On-line Data in Astronomy, eds. M. A. Albrecht (Kluwer Academic Publishers), & D. Egret, Astrophysics and Space Science Library, 171, 79 [NASA ADS] [CrossRef] [Google Scholar]
- Eisenhardt, P. R. M., Marocco, F., Fowler, J. W., et al. 2020, ApJS, 247, 69 [Google Scholar]
- Farihi, J. 2016, New Astron. Rev., 71, 9 [Google Scholar]
- Farihi, J., Jura, M., Lee, J. E., & Zuckerman, B. 2010, ApJ, 714, 1386 [NASA ADS] [CrossRef] [Google Scholar]
- Farihi, J., Wyatt, M. C., Greaves, J. S., et al. 2014, MNRAS, 444, 1821 [NASA ADS] [CrossRef] [Google Scholar]
- Fontaine, G., Brassard, P., & Bergeron, P. 2001, PASP, 113, 409 [NASA ADS] [CrossRef] [Google Scholar]
- French, J. R., Casewell, S. L., Dupuy, T. J., et al. 2023, MNRAS, 519, 5008 [CrossRef] [Google Scholar]
- Gänsicke, B. T., Koester, D., Farihi, J., et al. 2012, MNRAS, 424, 333 [CrossRef] [Google Scholar]
- Gentile Fusillo, N. P., Tremblay, P.-E., Gänsicke, B. T., et al. 2019, MNRAS, 482, 4570 [Google Scholar]
- Gentile Fusillo, N. P., Tremblay, P. E., Cukanovaite, E., et al. 2021, VizieR Online Data Catalog: J/MNRAS/508/3877 [NASA ADS] [Google Scholar]
- Girven, J., Gänsicke, B. T., Steeghs, D., & Koester, D. 2011, MNRAS, 417, 1210 [Google Scholar]
- Graham, J. R., Matthews, K., Neugebauer, G., & Soifer, B. T. 1990, ApJ, 357, 216 [NASA ADS] [CrossRef] [Google Scholar]
- Harrison, J. H. D., Bonsor, A., & Madhusudhan, N. 2018, MNRAS, 479, 3814 [NASA ADS] [CrossRef] [Google Scholar]
- Hoard, D. W., Brinkworth, C. S., & Wachter, S. 2007, in 15th European Workshop on White Dwarfs, eds. R. Napiwotzki, & M. R. Burleigh (San Francisco: ASP), ASP Conf. Ser., 372, 501 [NASA ADS] [Google Scholar]
- Hoard, D. W., Debes, J. H., Wachter, S., Leisawitz, D. T., & Cohen, M. 2013, ApJ, 770, 21 [NASA ADS] [CrossRef] [Google Scholar]
- Holberg, J. B., & Bergeron, P. 2006, AJ, 132, 1221 [Google Scholar]
- Hollands, M. A., Koester, D., Alekseev, V., Herbert, E. L., & Gänsicke, B. T. 2017, MNRAS, 467, 4970 [NASA ADS] [Google Scholar]
- Hollands, M. A., Gänsicke, B. T., & Koester, D. 2018, MNRAS, 477, 93 [NASA ADS] [CrossRef] [Google Scholar]
- Hunter, J. D. 2007, Comput. Sci. Eng., 9, 90 [NASA ADS] [CrossRef] [Google Scholar]
- Jura, M. 2003, ApJ, 584, L91 [Google Scholar]
- Kaltenegger, L., MacDonald, R. J., Kozakis, T., et al. 2020, ApJ, 901, L1 [NASA ADS] [CrossRef] [Google Scholar]
- Kennedy, G. M., Wyatt, M. C., Sibthorpe, B., et al. 2012, MNRAS, 426, 2115 [NASA ADS] [CrossRef] [Google Scholar]
- Kiman, R., Xu, S., Faherty, J. K., et al. 2022, AJ, 164, 62 [NASA ADS] [CrossRef] [Google Scholar]
- Klein, B., Jura, M., Koester, D., Zuckerman, B., & Melis, C. 2010, ApJ, 709, 950 [NASA ADS] [CrossRef] [Google Scholar]
- Koester, D. 2008, arXiv e-prints [arXiv:0812.0482] [Google Scholar]
- Lai, S., Dennihy, E., Xu, S., et al. 2021, ApJ, 920, 156 [NASA ADS] [CrossRef] [Google Scholar]
- Marocco, F., Eisenhardt, P. R. M., Fowler, J. W., et al. 2021, ApJS, 253, 8 [Google Scholar]
- Melis, C., Dufour, P., Klein, B., et al. 2020, The biological potential of other worlds: comparing the phosphorus content of wet and dry exoplanetary crusts, HST Proposal, Cycle 28, ID. #16169 [Google Scholar]
- Mullally, F., Kilic, M., Reach, W. T., et al. 2007, ApJS, 171, 206 [NASA ADS] [CrossRef] [Google Scholar]
- pandas development team, T. 2023, https://doi.org/10.5281/zenodo.8364959 [Google Scholar]
- Putirka, K. D., & Xu, S. 2021, Nat. Commun., 12, 6168 [NASA ADS] [CrossRef] [Google Scholar]
- Rebassa-Mansergas, A., Solano, E., Xu, S., et al. 2019, MNRAS, 489, 3990 [Google Scholar]
- Sarna, M. J., Ergma, E., & Gerškevitš-Antipova, J. 2000, MNRAS, 316, 84 [NASA ADS] [CrossRef] [Google Scholar]
- Schlafly, E. F., Meisner, A. M., & Green, G. M. 2020, VizieR Online Data Catalog: II/363 [Google Scholar]
- Shestakova, L. I., Kenzhebekova, A. I., & Serebryanskiy, A. V. 2022, MNRAS, 514, 997 [NASA ADS] [CrossRef] [Google Scholar]
- Steele, P. R., Saglia, R. P., Burleigh, M. R., et al. 2013, MNRAS, 429, 3492 [NASA ADS] [CrossRef] [Google Scholar]
- Su, K. Y., Chu, Y., & Bilikova, J. 2013, in AAS Meeting Abstracts, 221, 308.05 [NASA ADS] [Google Scholar]
- Swan, A., Farihi, J., & Wilson, T. G. 2019, MNRAS, 484, L109 [NASA ADS] [CrossRef] [Google Scholar]
- Taylor, M. B. 2005, in Astronomical Data Analysis Software and Systems XIV, eds. P. Shopbell, M. Britton, & R. Ebert (San Francisco : ASP), ASP Conf. Ser., 347, 29 [NASA ADS] [Google Scholar]
- Virtanen, P., Gommers, R., Oliphant, T. E., et al. 2020, Nat. Methods, 17, 261 [Google Scholar]
- von Hippel, T., Kuchner, M. J., Kilic, M., Mullally, F., & Reach, W. T. 2007, ApJ, 662, 544 [Google Scholar]
- Wang, Z., Tziamtzis, A., & Wang, X. 2014, ApJ, 782, 20 [NASA ADS] [CrossRef] [Google Scholar]
- Wang, L., Zhang, X., Wang, J., et al. 2023, ApJ, 944, 23 [NASA ADS] [CrossRef] [Google Scholar]
- Wilson, T. G., Farihi, J., Gänsicke, B. T., & Swan, A. 2019, MNRAS, 487, 133 [CrossRef] [Google Scholar]
- Wright, E. L., Eisenhardt, P. R. M., Mainzer, A. K., et al. 2010, AJ, 140, 1868 [Google Scholar]
- Xu, S., & Bonsor, A. 2021, Elements, 17, 241 [NASA ADS] [CrossRef] [Google Scholar]
- Xu, S., & Jura, M. 2012, ApJ, 745, 88 [NASA ADS] [CrossRef] [Google Scholar]
- Xu, S., Jura, M., Pantoja, B., et al. 2015, ApJ, 806, L5 [NASA ADS] [CrossRef] [Google Scholar]
- Xu, S., Dufour, P., Klein, B., et al. 2019, AJ, 158, 242 [NASA ADS] [CrossRef] [Google Scholar]
- Xu, S., Lai, S., & Dennihy, E. 2020, ApJ, 902, 127 [NASA ADS] [CrossRef] [Google Scholar]
- Zuckerman, B., & Becklin, E. E. 1987, Nature, 330, 138 [NASA ADS] [CrossRef] [Google Scholar]
- Zuckerman, B., Koester, D., Melis, C., Hansen, B. M., & Jura, M. 2007, ApJ, 671, 872 [Google Scholar]
Although carbon molecules can be dredged up from deeper layers by the convection zone (Koester 2008).
All Tables
Median and standard deviation of the magnitude and color-excess methods from Sample D.
Sample D, specifying those sources with infrared excesses (Sample F), as well as the contaminated sources (the ones excluded in the step from Sample E to Sample F).
Summary of the Spitzer-confirmed white dwarfs with an infrared excess as identified by this work.
Summary of the number of infrared excess candidates (Sample E) in Gaia DR2 from Xu et al. (2020) that are found in each sample of our work.
Summary of the number of white-dwarf infrared-excess candidates (Sample E) from Xu et al. (2020) that are recovered in this work as a function of the method used (magnitude excess, color excess, or both).
All Figures
|
Fig. 1 Flowchart showing the five steps of our selection of infrared excess candidates. |
| In the text | |
|
Fig. 2 W1 and W2 mag values as a function of their magnitude and color excess in Sample D. Sample D is divided into white dwarfs with G < 17 (first row) and with 17 ≤ G < 18.5 (second row). Spitzer-confirmed dusty white dwarfs and white dwarf-main sequence or M dwarf pairs (red); and white dwarfs with brown dwarfs companion (green) are represented. The orange line is the cut chosen to consider IR excess beyond it. The numbers next to the line are the number of sources we found on each side. We note that the IR excess distributions are non-normal and that the limit of three standard deviations from the median typically leaves us with 10% of the sample. |
| In the text | |
|
Fig. 3 Gaia HR diagram of white dwarfs from initial Sample A (yellow) and final Sample F (pink). |
| In the text | |
|
Fig. 4 Comparison of the number of the infrared excess candidates found in this study (Sample F1, pink) and in (Xu et al. 2020; using the Gaia DR2 and unWISE catalogs – in yellow) as a function of their W1 (upper panel) and W2 (lower panel) magnitudes. |
| In the text | |
|
Fig. 5 Comparison of final infrared excess EDR3 candidates from our work (Sample F1, pink) and Spitzer-confirmed dusty white dwarfs (black) depending on their temperature and mass. |
| In the text | |
Current usage metrics show cumulative count of Article Views (full-text article views including HTML views, PDF and ePub downloads, according to the available data) and Abstracts Views on Vision4Press platform.
Data correspond to usage on the plateform after 2015. The current usage metrics is available 48-96 hours after online publication and is updated daily on week days.
Initial download of the metrics may take a while.