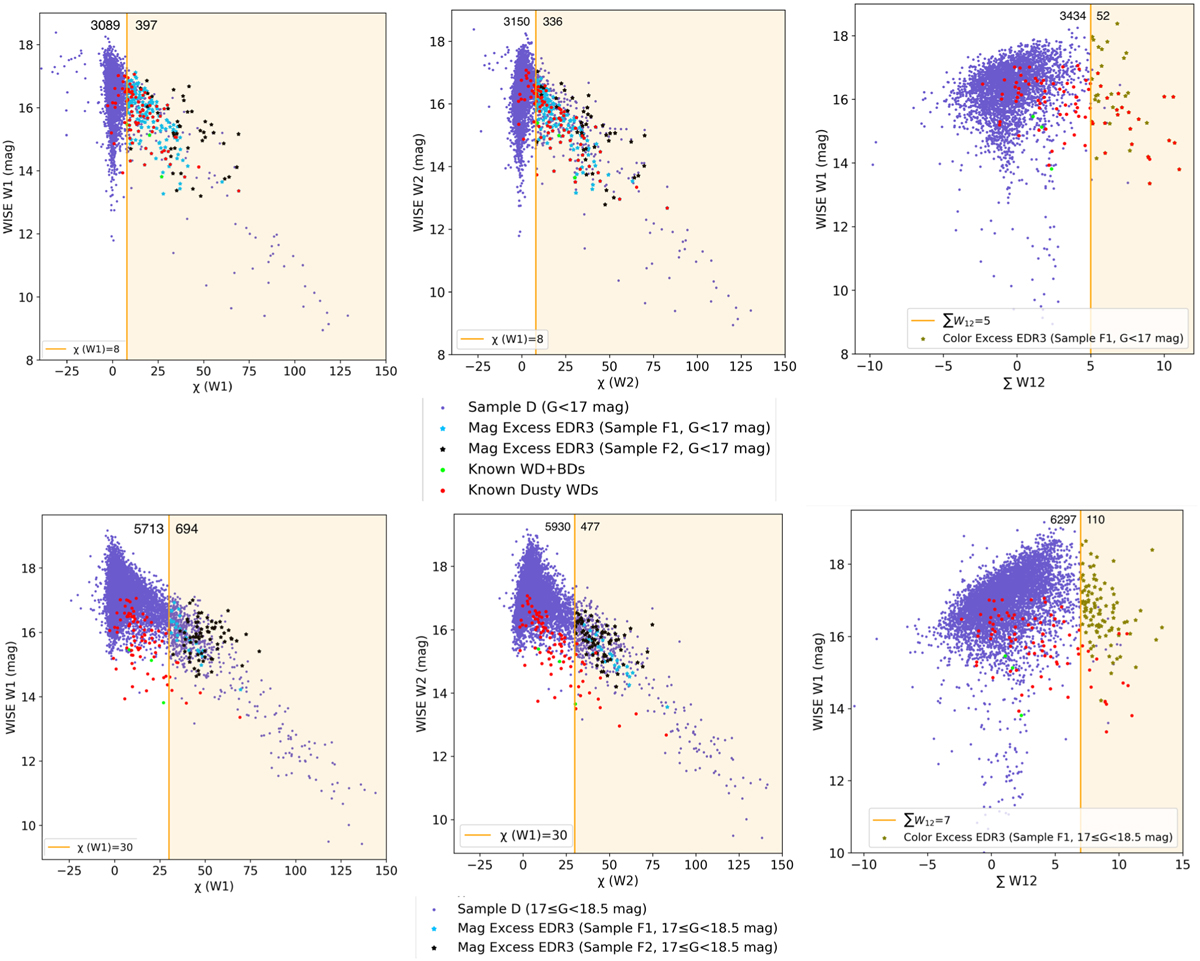
Fig. 2
Download original image
W1 and W2 mag values as a function of their magnitude and color excess in Sample D. Sample D is divided into white dwarfs with G < 17 (first row) and with 17 ≤ G < 18.5 (second row). Spitzer-confirmed dusty white dwarfs and white dwarf-main sequence or M dwarf pairs (red); and white dwarfs with brown dwarfs companion (green) are represented. The orange line is the cut chosen to consider IR excess beyond it. The numbers next to the line are the number of sources we found on each side. We note that the IR excess distributions are non-normal and that the limit of three standard deviations from the median typically leaves us with 10% of the sample.
Current usage metrics show cumulative count of Article Views (full-text article views including HTML views, PDF and ePub downloads, according to the available data) and Abstracts Views on Vision4Press platform.
Data correspond to usage on the plateform after 2015. The current usage metrics is available 48-96 hours after online publication and is updated daily on week days.
Initial download of the metrics may take a while.