Fig. 7
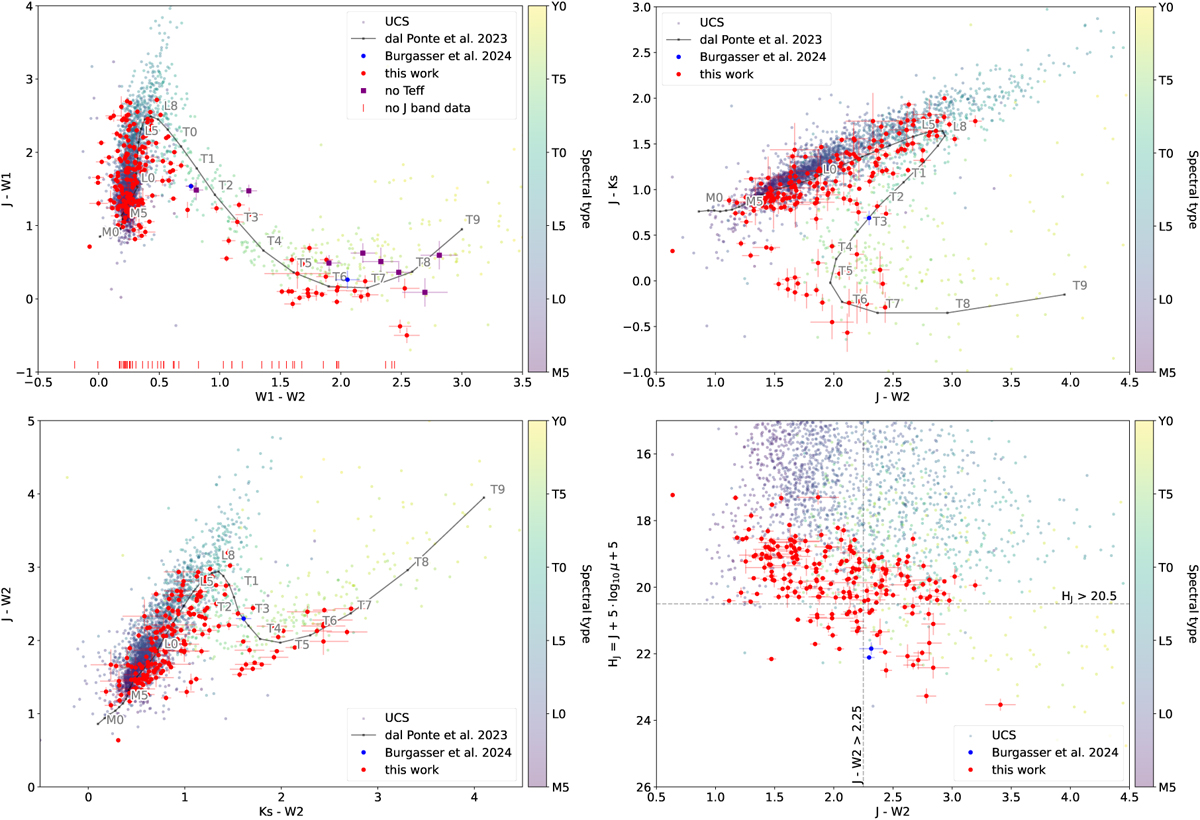
Download original image
Positions of the new moving objects we detected (red circles with error bars) in infrared two-color and reduced J magnitude diagrams for the known ultracool dwarfs from UltracoolSheet (Best et al. 2024a). The colors of known objects correspond to their spectral class according to the color bars to the right of the plots. The blue points show spectroscopically confirmed T subdwarfs from Burgasser et al. (2024b) that we also detected. The black line marks the template colors of ultracool dwarfs according to dal Ponte et al. (2023). The vertical red ticks at the bottom of the left panel mark the WISE color of objects that do not have associated J band measurements. Purple points also mark the objects for which we did not get enough multiwavelength data for the VOSA spectral fit, but for which J band data are still available. Dashed black lines in the bottom right panel mark the criteria for the selection of candidate T subdwarfs in Burgasser et al. (2024b).
Current usage metrics show cumulative count of Article Views (full-text article views including HTML views, PDF and ePub downloads, according to the available data) and Abstracts Views on Vision4Press platform.
Data correspond to usage on the plateform after 2015. The current usage metrics is available 48-96 hours after online publication and is updated daily on week days.
Initial download of the metrics may take a while.