Fig. 1
Download original image
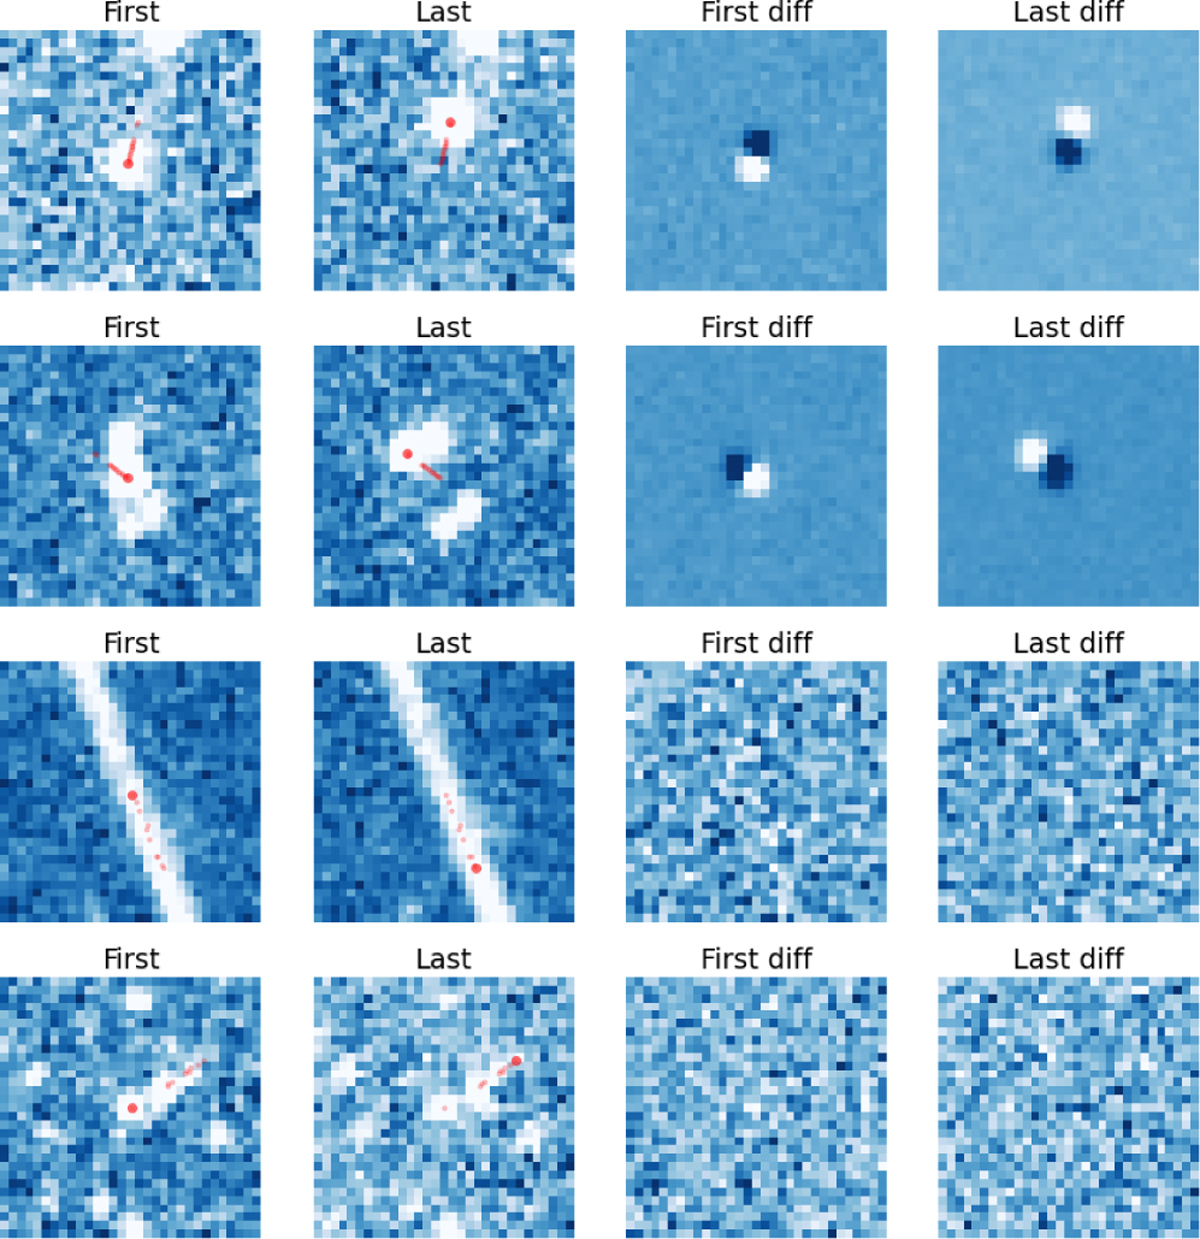
Examples of images used to visually check the moving object candidates selected by the algorithm described in Section 2.1. Each row displays the cutouts from the first and last epochs in unWISE coadds, and the corresponding differences between the images and median of all available epochs. All cutouts are centered on the position of the object from the first epoch (so that it is in the center in the first and third columns). Red dots mark the positions of the objects from all available epochs, with the larger circle corresponding to the current epoch of the image. The first and second rows display the actual moving objects, for isolated and crowded fields, while the third one shows an artifact due to a bright star spike, and the last a spurious candidate due to linking together individual detections of several stationary objects located roughly along the line.
Current usage metrics show cumulative count of Article Views (full-text article views including HTML views, PDF and ePub downloads, according to the available data) and Abstracts Views on Vision4Press platform.
Data correspond to usage on the plateform after 2015. The current usage metrics is available 48-96 hours after online publication and is updated daily on week days.
Initial download of the metrics may take a while.