| Issue |
A&A
Volume 695, March 2025
|
|
|---|---|---|
| Article Number | A190 | |
| Number of page(s) | 6 | |
| Section | Interstellar and circumstellar matter | |
| DOI | https://doi.org/10.1051/0004-6361/202451915 | |
| Published online | 19 March 2025 | |
The aluminium-26 distribution in a cosmological simulation of a Milky Way-type Galaxy
1
Institute of Theoretical Physics, University of Wrocław,
50-204
Wrocław,
Poland
2
Konkoly Observatory, HUN-REN Research Centre for Astronomy and Earth Sciences,
Konkoly Thege Miklós út 15-17.
1121,
Hungary
3
CSFK, MTA Centre of Excellence,
Budapest,
Konkoly Thege Miklós út 15-17.
1121,
Hungary
4
Centre for Astrophysics Research, University of Hertfordshire,
College Lane,
Hatfield
AL10 9AB,
UK
5
Computer, Computational and Statistical Sciences (CCS) Division, Center for Theoretical Astrophysics, Los Alamos National Laboratory,
Los Alamos,
NM
87545,
USA
6
ELTE Eötvös Loránd University, Institute of Physics and Astronomy,
Budapest
1117,
Pázmány Péter sétány 1/A,
Hungary
7
School of Physics and Astronomy, Monash University,
VIC 3800,
Australia
★ Corresponding author; benjamin.wehmeyer@uwr.edu.pl
Received:
18
August
2024
Accepted:
23
February
2025
Context. The 1.8 MeV γ-rays corresponding to the decay of the radioactive isotope 26Al (with a half-life of 0.72 Myr ) have been observed by the SPI detector on the INTEGRAL spacecraft and extensively used as a tracer of star formation and current nucleosynthetic activity in the Milky Way Galaxy. Further information is encoded in the observation related to the higher 26Al content found in regions of the Galaxy with the highest line-of-sight (LoS) velocity relative to an observer located in the Solar System. However, this feature remains unexplained.
Aims. We ran a cosmological “zoom-in” chemodynamical simulation of a Milky Way-type galaxy, including the production and decays of radioactive nuclei in a fully self-consistent way. We then analyzed the results to follow the evolution of 26Al throughout the lifetime of the simulated galaxy to provide a new method for interpreting the 26Al observations.
Methods. We included the massive star sources of 26Al in the Galaxy and its radioactive decay into a state-of-the-art galactic chemical evolution model, coupled with cosmological growth and hydrodynamics. This approach allowed us to follow the spatial and temporal evolution of the 26Al content in the simulated galaxy.
Results. Our results are in agreement with the observations with respect to the fact that gas particles in the simulation with relatively higher 26Al content also have the highest LoS velocities. On the other hand, gas particles with relatively lower 26Al content (i.e., not bright enough to be observed) generally display the lowest LoS velocities. However, this result is not conclusive because the overall rotational velocity of our simulated galaxy is higher than that observed for cold CO gas in the Milky Way Galaxy. Furthermore, we found no significant correlation between gas temperature, rotational velocity, and 26Al content at any given radius. We also found the presence of transient 26Al-rich spots at low LoS velocities and we show that one such spot had been captured by the INTEGRAL/SPI data. Based on our model, we present a prediction for the detection of 1.8 MeV γ-rays by the future COSI mission. We find that according to our model, the new instrument will be able to observe similar 26Al-emission patterns to those seen by INTEGRAL/SPI.
Key words: ISM: abundances / evolution / ISM: kinematics and dynamics / Galaxy: abundances / Galaxy: evolution
© The Authors 2025
 Open Access article, published by EDP Sciences, under the terms of the Creative Commons Attribution License (https://creativecommons.org/licenses/by/4.0), which permits unrestricted use, distribution, and reproduction in any medium, provided the original work is properly cited.
This article is published in open access under the Subscribe to Open model. Subscribe to A&A to support open access publication.
1 Introduction
The short-lived radioactive isotope 26Al, with a a half-life of 0.72 Myr , is primarily produced and ejected by massive stars and their core-collapse supernovae (CCSNe). The detection of the 1.8 MeV γ-ray produced by its decay makes it a tracer of active nucleosynthesis and star formation in the Galaxy (Prantzos & Diehl 1996; Diehl & Prantzos 2023) and a means to study dynamics and feedback processes in the interstellar medium (ISM, Diehl et al. 2006, 2010; Wang et al. 2009; Kretschmer et al. 2013; Bouchet et al. 2015; Siegert & Diehl 2017). One main observational feature of such detection, however, remains a topic of speculation and debate: when plotted according to their location and line-of-sight (LoS) velocity relative to the Solar System, the γ-ray flux tracing the 26Al content, is higher for higher LoS velocities. Specifically, the LoS velocity of the 26Al-rich regions reaches values higher than those observed with CO. To resolve this tension, several models and scenarios have been discussed, which can roughly be divided into two groups.
Previous works (Krause et al. 2018; Diehl et al. 2010; Rodgers-Lee et al. 2019) have suggested that the component with both a high LoS velocity and high 26Al content is caused by young star associations that migrate towards the front of spiral arms. When CCSNe occur in these associations and eject 26Al isotropically, the component of the produced 26Al traveling away from the spiral arm would have a higher velocity for an observer than the component traveling towards the inside of the spiral arm. This is due to the different gas density, as it would slow down the ejected 26Al (see also, e.g., Diehl 2022; Diehl & Prantzos 2023). Some of these models rely on the presence of long-lived, stationary, density wave-type spiral arms, leading to an asymmetry between the lead and tail side of the spiral arm. However, numerical, long-duration galaxy simulations have shown that spiral arms are rather short-lived (on the order of 100 My) and non-stationary (Wada et al. 2011; Grand et al. 2012; Baba et al. 2013).
The other approach suggests that the component with high LoS velocity and high 26Al content is due to foreground material. To achieve the high LoS velocities of 26Al seen in the INTEGRAL/SPI observations, it is required that we set the Solar System in a superbubble with a fresh 26Al supply (e.g., Fujimoto et al. 2020). This scenario initially appeared to be in agreement with the detection of fresh interstellar 60Fe and 244Pu in deep-sea sediments and Earth crust samples, however, it was later shown that these isotopes might have originated from farther away and could have been brought to the Solar System by diffusion (Hotokezaka et al. 2015). On this basis, a local enriched bubble would not necessarily be required to explain these deep-sea detections (Wehmeyer et al. 2023).
To revisit this problem, we used the cosmological, chemodynamical zoom-in simulation of a Milky-Way type galaxy described in Haynes & Kobayashi (2019) and Vincenzo & Kobayashi (2020), which includes star formation, feedback, and detailed chemical enrichment. It reproduces a number of observations in the Milky Way (see Kobayashi & Taylor 2023, for a review).
In this paper we include, for the first time, the production and decay of 26Al, fully self-consistently. We also give a comparison of the locations and velocities of 26Al-rich gas particles in the simulated galaxy with the measurements of INTEGRAL/SPI.
Our model represents a first-principle realisation of the 26Al content in the simulated galaxy, as it does not rely on assumptions about density wave-type spiral arms, fixed axisymmetric stellar and dark matter distributions (as, e.g., done in Fujimoto et al. 2018), stochastic star formation (as, e.g., done in Fujimoto et al. 2020), or snapshots of longer-lasting galaxy simulation models. Instead, we used a cosmological zoom-in model coupled with a state-of-the-art galactic chemical evolution (GCE) model to investigate the chemical and dynamical evolution of a simulated galaxy, whose star formation history is determined from cosmological accretion of gas, a series of minor mergers of satellite galaxies, and feedback from previous generation of stars. In Section 2.1, we describe our method and the galaxy evolution model. In Section 3, we present the model predictions, along with a comparison to the observational data and predictions for the detections of the future COSI mission.
2 Methods
2.1 Cosmological zoom-in model
We used a state-of-the-art GCE model coupled with the hydrodynamical code Gadget-3 (Springel 2005). For all the stable elements, the code includes the most up-to-date nucleosynthesis yields from asymptotic giant branch (AGB) stars, which evolve from low-mass stars, core-collapse supernovae (CCSNe, including hypernovae, Kobayashi et al. 2020a), and Type Ia supernovae (Kobayashi et al. 2020b). The code was originally developed by Kobayashi (2004); Kobayashi et al. (2007) and applied to simulate a Milky-Way-type galaxy, as described by Kobayashi & Nakasato (2011); Haynes & Kobayashi (2019); Vincenzo & Kobayashi (2020). The details, including all the relevant mathematical formulae, can be found in Kobayashi & Taylor (2023). In brief, the most relevant features of the model are:
-
The gravitational forces are calculated with tree-particlemesh scheme and hydrodynamics is followed according to the smoothed-particle-hydrodynamics (SPH) method (Springel 2005).
-
The metal-dependent cooling functions are generated with the MAPPINGS III software (Sutherland & Dopita 1993), assuming the observed [O/Fe]–[Fe/H] relation in the solar neighborhood.
-
The star formation criteria are (i) convergent, (ii) cooling, and (iii) Jeans unstable. For the star formation rate, we used a Schmidt law, namely, the star formation timescale is proportional to the dynamical timescale, t sf ≡ t dyn/c, where c is a constant equal to 0.02.
-
Once the star formation criterion is fulfilled in a gas particle, some of its mass converts into a star particle with a mass, m, between 105 M⊙ ≲ m ≲ 106 M⊙. For the masses of individual stars in the star particles, we used the IMF from Kroupa (2008) (with the massive-end slope of x = 1.3) in the mass range of 0.01 M⊙ ≤ m ≤ 120 M⊙.
-
The energy and heavy element yields from dying star particles are distributed to a fixed number, N FB = 64, of neighbouring gas particles, weighted by the SPH kernel. Further metal diffusion is not included as no impact of it was found in Haynes & Kobayashi (2019). The energy from stellar winds and supernovae (each between 1 and 30 × 1051 erg) is thermally distributed.
The cosmological initial conditions (at redshift z = 127) are the same as in Haynes & Kobayashi (2019); Vincenzo & Kobayashi (2020). The initial mass of each gas particle is 3.3 × 10⁶ M⊙ and the gravitational softening length is 1.4 kpc . The detailed star formation history and the spatial distributions of gas, stars, and metals can be found in Haynes & Kobayashi (2019); Vincenzo & Kobayashi (2020); there is the bulge, the thin and thick disks, and the halo, as in our Milky Way. The bulge is formed by an assembly of gas-rich sub-galaxies at z ≳ 2 and the majority of stars there are old, metal-rich, and α-enhanced. The disk is formed insideout and star formation takes place continuously, self-regulated by cosmological inflow and supernova-driven outflow, generating the decreasing trend of [α/Fe] ratio toward lower metallicities, consistently with the observations.
The main difference between the Kobayashi & Nakasato (2011); Haynes & Kobayashi (2019); Vincenzo & Kobayashi (2020) model and this work is, that we introduce radioactive nuclei as described in the following Section. Note that the introduction of these nuclei does not alter the evolution of the simulated galaxy (e.g., age-metallicity relation, star formation rate), except for the presence of these nuclei.
2.2 Radioactive nuclei
The stellar sources of 26Al have been extensively discussed in the literature (see, e.g., Prantzos & Diehl 1996; Diehl et al. 2021; Laird et al. 2023, for reviews). Here, we chose CCSNe from massive stars as the exclusive 26Al source. The literature also considers other sources of 26Al : (super-)AGB stars and novae. For AGB stars, Lugaro & Karakas (2008) found that the initial mass function (IMF)-averaged contribution divided by the contribution of CCSNe is only on the order of 0.2%. Super-AGB stars, which have significantly higher 26Al yields than AGB stars, still only contribute to about 10% of the Galactic inventory. For instance, Siess & Arnould (2008) also found that their impact on GCE would be insignificant. For novae, despite the fact that some studies (Vasini et al. 2022, 2025) have claimed a relative contribution to the Galactic inventory of up to 75%, Laird et al. (2023) pointed out that their contribution is subject to huge uncertainties regarding their progenitors (ONe white dwarfs versus ONeMg white dwarfs) and the metallicity range in which they would contribute. They find a find a Galactic contribution of only about 12% (e.g., Laird et al. 2023). Furthermore, the observed 26Al distribution is consistent with massive stars being the dominant source of the Galactic 26Al (Prantzos & Diehl 1996; Diehl et al. 2006). Still, the unclear and recently newly discussed nova contribution to the Galactic 26Al inventory should be studied using a cosmological model in the future.
Overview of the different locations and velocities used in the text and figures.
In our simulation, we used CCSNe in the mass range 13 M⊙ ≤ m ≤ 40 M⊙, with the yields from Nomoto et al. (2013), and AGB stars, with the yields from Table S1 in Lugaro et al. (2014) as 26Al sources. Averaging the Nomoto et al. (2013) 26Al yields over the Salpeter IMF (with a constant slope −1.35), the average 26Al yield is ≈ 2.90 × 10⁻⁵ M⊙(≈ 1.03 × 10⁻⁶ M⊙ for 26Al from AGB stars). For comparison, Fujimoto et al. (2020) used the Sukhbold et al. (2016) yields, but multiplied by a factor of two (to ensure that the steady-state mass ratio of 60Fe 26Al is consistent with observations), which corresponds to a yield of 2.72−8.44 × 10⁻⁵ M⊙ of 26Al, depending on the supernova engine. Rodgers-Lee et al. (2019) and Krause et al. (2021) injected a passive scalar tracer fluid evolving according to the Voss et al. (2009) population synthesis model every time a superbubble forms and used the yields from Limongi & Chieffi (2006) or Woosley & Weaver (1995), which give the IMF-averaged 26Al yield of ≈ 6.17 × 10⁻⁵ M⊙, or ≈ 5.84 × 10⁻⁵ M⊙, respectively. Pleintinger et al. (2019) used a population synthesis code (Stochastically Lighting Up Galaxies, SLUG; e.g., da Silva et al. 2012; Krumholz et al. 2015) with the Sukhbold et al. (2016) yields (see above numbers, but noting that in that study, they did not multiply by a factor of two). For Vasini et al. (2025), in their Model-1, as 26Al sources, they used low mass (m ≤ 6 M⊙) AGB stars (yields from Karakas 2010), SNeIa ( 26Al yields from Nomoto et al. 1984), and CCSNe (yields from Woosley & Weaver 1995). Despite the rather high averaged 26Al CCSN yield, this model had difficulties reaching the observed galactic 26Al content. Hence, they introduced their Model-2, with novae (26Al yield ≈ 6.17 × 10⁻⁵ M⊙ of 26Al per event, according to the simulations of José & Hernanz 2007, with the occurrence considerations in Romano & Matteucci 2003; Vasini et al. 2022) as an additional 26Al production site.
In our simulation, 26Al produced by CCSNe in star particles is distributed in the same way as stable nuclei to neighboring gas particles. To determine the abundance of 26Al (i.e., Y 26) in a particle in the current time step (t+Δt), we use the exponential decay law Y 26(t+Δt) = Y 26(t) exp (−Δ t/τ 26), with τ 26(=1.035 Myr) being the mean life of 26Al, and Y 26(t) the abundance of 26Al in the gas particle in the previous time step. The heating from radioactive decay of 26Al is negligible for galaxy evolution.
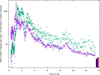 |
Fig. 1 Star formation rate in solar masses per year (magenta crosses), and total 26Al mass in solar masses (green crosses) in the simulated galaxy as a function of galactic evolution time. Today’s values for the total 26Al content in the Galaxy deduced from the INTEGRAL/SPI observations (2.8 ± 0.8 M⊙, Diehl et al. 2006) are indicated by a (timeoffset) blue box, and estimates for the current star formation rate in the Galaxy (0.35−3.9 M⊙ per year, Table 1 in Elia et al. 2022) are indicated by a (time-offset) red box. Note: the red box continues below the figure. |
3 Results
We present our results in terms of 26Al content, locations, and velocities. The different locations and velocities used below are summarized in Table 1, together with their definition and where we used them to illustrate the results.
3.1 26Al-distribution in the galaxy
Figure 1 shows the time evolution of the star formation rate and the total 26Al mass contained in the simulated galaxy. At t ≳ 6 Gyr, the 26Al content in the galaxy has settled into a steady state. In the equilibrium state, the star formation rate fluctuates between roughly one solar mass per year up to several hundreds of solar masses per year, while the total 26Al content in the galaxy fluctuates between roughly 3 and 30 solar masses of 26Al. The lower limit of these fluctuations is consistent with the estimate of 1.7 M⊙ ≤ m26 ≤ 3.5 M⊙ in Diehl et al. 2021 and slightly more than the best estimate of 2 M⊙ of 26Al in Pleintinger 2020 and the calculations of Fujimoto et al. (2020) for the galactic disk (≈ 1.1 M⊙ of 26Al).
Figure 2 shows the present-day distribution of the disk’s gas particles in our simulation, color-coded according to their 26Al content. The figure also shows the contours of the LoS velocity of the particles, relative to the observer (Solar System) located at ![$\overrightarrow{x_{\odot}}=[0: 0: 0]$](/articles/aa/full_html/2025/03/aa51915-24/aa51915-24-eq9.png) . This helps us to identify the location of the particles with the fastest LoS velocity. In the galactic center, where the star formation activity is the highest, a highly (relatively homogeneously) 26Al-enriched region is found. Outside of the galactic center, scattered 26Al-enriched regions are found. The cores of such scattered 26Al-bright spots host young star particles. Given the short life of massive stars, these particles feature a strong supernova (and thus 26Al production) activity. This leads to a high 26Al abundance in the surrounding ISM of these star particles. New stars that form in these regions of the ISM also have a high 26Al abundance. As time progresses, the supernova activity in the dying star particles decreases, the radioactive decay of 26Al dominates over its production and the amount of 26Al decreases in both the star particles and in the surroundings.
. This helps us to identify the location of the particles with the fastest LoS velocity. In the galactic center, where the star formation activity is the highest, a highly (relatively homogeneously) 26Al-enriched region is found. Outside of the galactic center, scattered 26Al-enriched regions are found. The cores of such scattered 26Al-bright spots host young star particles. Given the short life of massive stars, these particles feature a strong supernova (and thus 26Al production) activity. This leads to a high 26Al abundance in the surrounding ISM of these star particles. New stars that form in these regions of the ISM also have a high 26Al abundance. As time progresses, the supernova activity in the dying star particles decreases, the radioactive decay of 26Al dominates over its production and the amount of 26Al decreases in both the star particles and in the surroundings.
Therefore, the 26Al-bright spots outside the galactic center are transient and disappear after a few Myr. We note that this clumpy structure is inherent to choosing massive stars as the only source of galactic 26Al. If asymptotic giant branch stars (or novae) were instead the dominant source, we would instead expect a much smoother distribution because these stars (i) have a much wider distribution of possible lifetime expectancies, which would allow them to produce and eject 26Al over much longer time spans and counteract radioactive decay over longer time scales; and (ii) tend to be more homogeneously distributed throughout the galaxy. This more even distribution of 26Al sources would then lead to a much more uniform 26Al distribution in the galaxy.
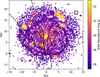 |
Fig. 2 The 26Al distribution in our simulated galaxy. The dots represent disk gas particles at present-day, color-coded to represent the mass of 26Al (in log (gram) unit). The red circle at coordinates [0:0:0] denotes the location of the observer (Solar System) at R ⊙ = 8.5 kpc from the galactic center. The black dashed lines indicate a viewing angle of −40 ≤ ϕ ≤−14, corresponding to the viewing angle highlighted by the black dashed vertical lines in Figure 3. The contour plots represent the LoS velocity to the observer. The outer (inner) black contour represents the ± 100 km/s(± 200 km/s) threshold. The single particles in the external regions with velocities higher than ± 100 km/s originate from an earlier dwarf galaxy disruption event. |
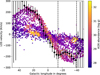 |
Fig. 3 26Al-longitude-LoS velocity diagram of the same disk gas particles of Figure 2, as seen from the location of the Solar System (i.e., the red circle in Figure 2), color-coded according to their 26Al content (in log (gram) unit). Black dots with error bars show the 26Al detection data by the INTEGRAL/SPI instrument (Kretschmer et al. 2013) and Karsten Kretschmer, personal communication. The dashed vertical lines highlight the region between the viewing angle −40 ≤ ϕ ≤ −14, corresponding to the dashed lines in Figure 2, showing the deviation discussed in the text. |
3.2 26Al-longitude-LoS velocity diagram
Figure 3 shows the 26Al content and LoS velocity of the simulated disk gas particles. We define the LoS velocity as the velocity of a simulated particle relative to the Solar System following the rotation of the simulated galaxy (counter-clockwise in the framework of Figure 2).
The simulated particles are compared to the data from the SPI detector on the INTEGRAL spacecraft, which was designed to detect the 1809 keV line from the decay of 26Al with an energy resolution of 3 keV. We plotted the 26Al decay γ-ray detection data by the INTEGRAL/SPI spacecraft (Kretschmer et al. 2013) as black error bars in Figure 3. Contrary to the approach of Kretschmer et al. (2013), we plotted the full distribution of detection angles (Karsten Kretschmer, personal comm.) to highlight the small deviation from the main detected trend between −40 ≤ ϕ ≤ − 14, which we discuss in more detail below. We note that this choice results in two neighboring detections not being statistically independent, because each detection overlaps the neighboring one by 75%.
It can be seen that, generally, the particles in the simulation that feature the highest 26Al mass (brightest colors) overlap with the Kretschmer et al. (2013) observations in that they also appear to have the highest LoS velocities (except for the few bright spots discussed below). Instead, the particles that feature lower 26Al mass do not overlap with the observations, as expected, since the low 26Al abundances are more difficult to detect and generally show lower LoS velocities. The 26Al-rich particles in the outer regions of the simulated galaxy do not strongly affect the diagram of Figure 3, as they are located in areas that do not feature a high relative velocity with respect to the observer (see Figure 2). The 26Al-rich areas within the high-velocity contours are instead located close by.
We note that our cosmological initial conditions result in a galaxy that is generally rotating faster than the Milky Way (Scannapieco et al. 2012). Although molecular clouds are not well resolved with the resolution of our simulation, the cold gas is rotating faster than the CO observation (e.g., Sofue et al. 2009). We do not see a significant correlation between gas temperature, rotational velocity, and 26Al content, at any given radius. Our simulation self-consistently produces the formation of the Galactic bulge. This greatly affects the shape of the rotational velocity, resulting in a fast increase in the rotational velocity from the center to a few kpc outwards, before showing a flat rotation curve. The shape of the observed 26Al-longitude-LoS velocity diagram is strongly determined by the velocity and 26Al content of the material near the bulge (Figure 2), which is self-consistently modelled in our simulation.
Figure 3 also shows a few 26Al-rich spots at low LoS velocities. The origin of these 26Al-rich spots can be identified by correspondence to the transient 26Al-rich spots seen in Figure 2. One such 26Al-rich spot reproduces the observed distinct deviation in the INTEGRAL/SPI detections at a viewing angle of −40 ≤ ϕ ≤−14. In Figure 2, the corresponding 26Al-rich spot is the one closest to the observer in this viewing angle, at the edge of the −200 km/s contour. This 26Al-rich spot, which matches the observed deviation is located at the edge of the −200 km/s contour in Figure 2. Inside the contour, there are particles that rotate faster, but have lower 26Al abundance than the 26Al-rich spot. This contrast causes the deviation observed by INTEGRAL/SPI. The other two predicted 26Al-rich spots were not detected by SPI; however, this was expected, as they are transient. On the other hand, Figure 1 shows that the current galactic period features below-average 26Al-content compared to the previous ≈4 Gy of evolution.
3.3 Future missions
The upcoming COSI mission will perform a full sky survey, collecting many more photos than INTEGRAL/SPI and thus providing a full galactic map with smaller uncertainties. This will be possible thanks to its field of view of 25% of the sky (relative to 1% of INTEGRAL/SPI), along with a similar spectral resolution and angular resolution of 1.8° (compared to 2.7°) to INTEGRAL/SPI.
We analysed our simulations using the angular resolution of 1.8° of the future γ-ray detection mission COSI (Tomsick et al. 2023). To achieve a view of our simulated galaxy as this future instrument will see it, we used the following method:
-
We take the spatial distribution of the gas particles from the simulation (Figure 2) and multiply the 26Al mass by the Avogadro number, then divide by its atomic mass 26 to obtain the number of 26Al atoms in the gas particle.
-
We multiply the number of 26Al atoms by the 26Al decay rate of 9.68 × 10⁻⁷ s−1 to find the number of 1.8 MeV γ-rays emitted per second by each gas particle.
-
We divide this number by the square root of the distance to the observer to account for the decrease in γ-ray counts with increased distance from the source. The result is shown in Figure 4. In the figure, we can see which parts of the simulated galaxy contribute the most 1.8 MeV γ-ray intensity towards an observer located at the location of the Solar System.
-
We sum up all the contributions located in each viewing cone from the observer, binned according to the resolution of the COSI instrument of (4.4°)2, as shown in Figure 5.
We predict that the instrument will receive the highest intensity of 26Al-decay γ-rays from the direction of the galactic plane. The majority of γ-rays, however, do not appear to originate from throughout the galactic plane uniformly, but their predicted distribution appears to be clumped, similarly to detections carried out by INTEGRAL/SPI (see Figure 1 of Kretschmer et al. 2013). This clumpiness originates from the 26Al-rich spots present throughout the galaxy, which is already considered as a key piece of evidence that low-mass AGB stars and novae are not the dominant source of 26Al in the Galaxy, as they would produce a more uniform distribution of γ-ray sources and, therefore, of the intensity as well.
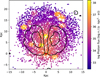 |
Fig. 4 Same as Figure 2, but color-coded as function of the number of emitted 1.8 MeV γ-rays per second by each gas particle, as seen by the observer. The outer (inner) black contour representing the 100 km/s (200 km/s) threshold (as in Figure 2) are retained here as a visual guide. |
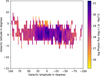 |
Fig. 5 Prediction for possible detection of 26Al-decay γ-ray as seen by the future COSI γ-ray detection mission. The x - and y - axis represent the viewing angles of the future instrument. Note: the color-coding here is opposite to that in Figs. 1 and 2 (to achieve a similar color-coding as in Kretschmer et al. 2013), so that higher intensity is represented by darker colors and no detection is represented by the white background. The pixels are Kaiser-interpolated to account for a possible neighbour dependence, as in INTEGRAL/SPI. |
4 Discussion and conclusions
We have run, for the first time, a cosmological zoom-in chemodynamical simulation of a Milky-Way-type galaxy including radioactive nuclei to predict the distribution of 26Al from massive stars in a simulated galaxy. Our main conclusions are as follows:
-
The 26Al distribution in the simulated galaxy appears clumped, rather than heterogeneous. This is a consequence of the fact that our model only includes CCSNe from massive stars as the source of 26Al, in agreement with previous observations by the INTEGRAL/SPI spacecraft (Kretschmer et al. 2013) and theoretical considerations (Prantzos & Diehl 1996; Wang et al. 2009; Bouchet et al. 2015; Diehl & Prantzos 2023). Massive stars are associated with young star clusters, which are distributed in a clumpy way throughout the galaxy.
-
The 26Al-rich regions generally appear at the highest LoS velocities to an observer located in the position of the Solar System. This in agreement with 26Al decay observations by the INTEGRAL/SPI spacecraft (Kretschmer et al. 2013) and confirms the results from the model of Fujimoto et al. (2020), for an observer outside of 26Al bubbles.
-
Transient 26Al-rich spots of lower LoS velocities are present in the simulation and one of them appears to be coincident with a deviations observed in the INTEGRAL/SPI detection.
-
We also illustrated our results as they would be observed by the future observation mission COSI. From our modeled galaxy, COSI would detect a similar, clumped 26 Al-emission pattern as INTEGRAL/SPI. This is due to 26Al predominantly produced in massive stars, which are spatially distributed in a less uniform way as intermediate mass stars.
Our model can trace the radioactivity in the galaxy following the structure formation, star formation, and chemical enrichment histories in a cosmological context. We showed that the observation can be well reproduced if the hot, 26Al-rich gas is rotating as fast as in our simulated galaxy with a clumpy distribution. As noted earlier in this work, however, our simulated galaxy is not exactly the same as our Milky Way Galaxy; specifically, it has a faster rotational velocity. Therefore, more simulations are required to investigate the behaviour of a galaxy with more similar properties to the Milky Way.
Future works will include more isotopes of interest, for example, 60Fe and 244Pu, and should also integrate more detailed propagation of radioactive isotopes, either in the form of gas or dust (e.g., Hotokezaka et al. 2018). Furthermore, the unclear role of novae (Vasini et al. 2022; Laird et al. 2023; Vasini et al. 2025) and their implications for the INTEGRAL/SPI detections should be addressed in a future cosmological model as well.
Acknowledgements
The authors thank Karsten Kretschmer for providing the detection data relevant for this work, Thomas Siegert for providing insights into the COSI instruments, and Roland Diehl, and Martin G. H. Krause for many useful discussions. B.W. acknowledges support from the National Center for Science (NCN, Poland) under Grant no. 2022/47/D/ST9/03092, as well as the National Science Foundation (NSF, USA) under Grant no. PHY-1430152 (JINA Center for the Evolution of the Elements) and Grant no. OISE-1927130 (IReNA). C.K. acknowledges funding from the UK Science and Technology Facility Council (STFC) through grant ST/R000905/1, & ST/V000632/1. The work was also funded by a Leverhulme Trust Research Project Grant on “Birth of Elements”. This work was supported by the ERC Consolidator Grant (Hungary) funding scheme (Project RADIOSTAR, G.A. no. 724560) and by the Lendület Program LP2023-10 of the Hungarian Academy of Sciences. We also thank the COST actions “ChETEC” (G. A. no. 16117) and “ChETECINFRA” (G. A. no. 101008324). M.L. was also supported by the NKFIH excellence grant TKP2021-NKTA-64. The work of AYL was supported by the US Department of Energy through the Los Alamos National Laboratory. Los Alamos National Laboratory is operated by Triad National Security, LLC, for the National Nuclear Security Administration of U.S. Department of Energy (Contract No. 89233218CNA000001). Some computations outlined in this paper were performed at the Wroclaw Centre for Scientific Computing and Networking (WCSS). We thank an anonymous reviewer for their valuable suggestions improving the manuscript.
References
- Baba, J., Saitoh, T. R., & Wada, K. 2013, ApJ, 763, 46 [Google Scholar]
- Bouchet, L., Jourdain, E., & Roques, J.-P. 2015, ApJ, 801, 142 [NASA ADS] [CrossRef] [Google Scholar]
- da Silva, R. L., Fumagalli, M., & Krumholz, M. 2012, ApJ, 745, 145 [CrossRef] [Google Scholar]
- Diehl, R. 2022, EPJ Web Conf., 260, 10001 [NASA ADS] [Google Scholar]
- Diehl, R., & Prantzos, N. 2023, arXiv e-prints [arXiv:2303.01825] [Google Scholar]
- Diehl, R., Halloin, H., Kretschmer, K., et al. 2006, Nature, 439, 45 [CrossRef] [PubMed] [Google Scholar]
- Diehl, R., Lang, M. G., Martin, P., et al. 2010, A&A, 522, A51 [NASA ADS] [CrossRef] [EDP Sciences] [Google Scholar]
- Diehl, R., Lugaro, M., Heger, A., et al. 2021, PASA, 38, e062 [NASA ADS] [CrossRef] [Google Scholar]
- Elia, D., Molinari, S., Schisano, E., et al. 2022, ApJ, 941, 162 [NASA ADS] [CrossRef] [Google Scholar]
- Fujimoto, Y., Krumholz, M. R., & Tachibana, S. 2018, MNRAS, 480, 4025 [NASA ADS] [CrossRef] [Google Scholar]
- Fujimoto, Y., Krumholz, M. R., & Inutsuka, S.-i. 2020, MNRAS, 497, 2442 [NASA ADS] [CrossRef] [Google Scholar]
- Grand, R. J. J., Kawata, D., & Cropper, M. 2012, MNRAS, 421, 1529 [CrossRef] [Google Scholar]
- Haynes, C. J., & Kobayashi, C. 2019, MNRAS, 483, 5123 [Google Scholar]
- Hotokezaka, K., Piran, T., & Paul, M. 2015, Nat. Phys., 11, 1042 [NASA ADS] [CrossRef] [Google Scholar]
- Hotokezaka, K., Beniamini, P., & Piran, T. 2018, Int. J. Mod. Phys. D, 27, 1842005 [Google Scholar]
- José, J., & Hernanz, M. 2007, J. Phys. G Nucl. Phys., 34, R431 [Google Scholar]
- Karakas, A. I. 2010, MNRAS, 403, 1413 [NASA ADS] [CrossRef] [Google Scholar]
- Kobayashi, C. 2004, MNRAS, 347, 740 [NASA ADS] [CrossRef] [Google Scholar]
- Kobayashi, C., & Nakasato, N. 2011, ApJ, 729, 16 [NASA ADS] [CrossRef] [Google Scholar]
- Kobayashi, C., & Taylor, P. 2023, arXiv e-prints [arXiv:2302.07255] [Google Scholar]
- Kobayashi, C., Springel, V., & White, S. D. M. 2007, MNRAS, 376, 1465 [Google Scholar]
- Kobayashi, C., Karakas, A. I., & Lugaro, M. 2020a, ApJ, 900, 179 [Google Scholar]
- Kobayashi, C., Leung, S.-C., & Nomoto, K. 2020b, ApJ, 895, 138 [CrossRef] [Google Scholar]
- Krause, M. G. H., Burkert, A., Diehl, R., et al. 2018, A&A, 619, A120 [NASA ADS] [CrossRef] [EDP Sciences] [Google Scholar]
- Krause, M. G. H., Rodgers-Lee, D., Dale, J. E., Diehl, R., & Kobayashi, C. 2021, MNRAS, 501, 210 [Google Scholar]
- Kretschmer, K., Diehl, R., Krause, M., et al. 2013, A&A, 559, A99 [NASA ADS] [CrossRef] [EDP Sciences] [Google Scholar]
- Kroupa, P. 2008, ASP Conf. Ser., 390, 3 [Google Scholar]
- Krumholz, M. R., Fumagalli, M., da Silva, R. L., Rendahl, T., & Parra, J. 2015, MNRAS, 452, 1447 [NASA ADS] [CrossRef] [Google Scholar]
- Laird, A. M., Lugaro, M., Kankainen, A., et al. 2023, J. Phys. G Nucl. Phys., 50, 033002 [CrossRef] [Google Scholar]
- Limongi, M., & Chieffi, A. 2006, ApJ, 647, 483 [NASA ADS] [CrossRef] [Google Scholar]
- Lugaro, M., & Karakas, A. I. 2008, New A Rev., 52, 416 [Google Scholar]
- Lugaro, M., Heger, A., Osrin, D., et al. 2014, Science, 345, 650 [CrossRef] [PubMed] [Google Scholar]
- Nomoto, K., Thielemann, F. K., & Yokoi, K. 1984, ApJ, 286, 644 [Google Scholar]
- Nomoto, K., Kobayashi, C., & Tominaga, N. 2013, ARA&A, 51, 457 [CrossRef] [Google Scholar]
- Pleintinger, M. M. M. 2020, PhD thesis, Max-Planck-Institute for Extraterrestrial Physics, Garching [Google Scholar]
- Pleintinger, M. M. M., Siegert, T., Diehl, R., et al. 2019, A&A, 632, A73 [NASA ADS] [CrossRef] [EDP Sciences] [Google Scholar]
- Prantzos, N., & Diehl, R. 1996, Phys. Rep., 267, 1 [NASA ADS] [CrossRef] [Google Scholar]
- Rodgers-Lee, D., Krause, M. G. H., Dale, J., & Diehl, R. 2019, MNRAS, 490, 1894 [NASA ADS] [CrossRef] [Google Scholar]
- Romano, D., & Matteucci, F. 2003, MNRAS, 342, 185 [Google Scholar]
- Scannapieco, C., Wadepuhl, M., Parry, O. H., et al. 2012, MNRAS, 423, 1726 [Google Scholar]
- Siegert, T., & Diehl, R. 2017, in 14th International Symposium on Nuclei in the Cosmos (NIC2016), ed. S. Kubono, T. Kajino, S. Nishimura, T. Isobe, S. Nagataki, T. Shima, & Y. Takeda, 020305 [Google Scholar]
- Siess, L., & Arnould, M. 2008, A&A, 489, 395 [NASA ADS] [CrossRef] [EDP Sciences] [Google Scholar]
- Sofue, Y., Honma, M., & Omodaka, T. 2009, PASJ, 61, 227 [NASA ADS] [Google Scholar]
- Springel, V. 2005, MNRAS, 364, 1105 [Google Scholar]
- Sukhbold, T., Ertl, T., Woosley, S. E., Brown, J. M., & Janka, H. T. 2016, ApJ, 821, 38 [NASA ADS] [CrossRef] [Google Scholar]
- Sutherland, R. S., & Dopita, M. A. 1993, ApJS, 88, 253 [Google Scholar]
- Tomsick, J. A., Boggs, S. E., Zoglauer, A., et al. 2023, arXiv e-prints [arXiv:2308.12362] [Google Scholar]
- Vasini, A., Matteucci, F., & Spitoni, E. 2022, MNRAS, 517, 4256 [NASA ADS] [CrossRef] [Google Scholar]
- Vasini, A., Spitoni, E., Matteucci, F., Cescutti, G., & Della Valle, M. 2025, A&A, 693, A37 [NASA ADS] [CrossRef] [EDP Sciences] [Google Scholar]
- Vincenzo, F., & Kobayashi, C. 2020, MNRAS, 496, 80 [NASA ADS] [CrossRef] [Google Scholar]
- Voss, R., Diehl, R., Hartmann, D. H., et al. 2009, A&A, 504, 531 [NASA ADS] [CrossRef] [EDP Sciences] [Google Scholar]
- Wada, K., Baba, J., & Saitoh, T. R. 2011, ApJ, 735, 1 [NASA ADS] [CrossRef] [Google Scholar]
- Wang, W., Lang, M. G., Diehl, R., et al. 2009, A&A, 496, 713 [NASA ADS] [CrossRef] [EDP Sciences] [Google Scholar]
- Wehmeyer, B., López, A. Y., Côté, B., et al. 2023, ApJ, 944, 121 [NASA ADS] [CrossRef] [Google Scholar]
- Woosley, S. E., & Weaver, T. A. 1995, ApJS, 101, 181 [Google Scholar]
All Tables
All Figures
|
Fig. 1 Star formation rate in solar masses per year (magenta crosses), and total 26Al mass in solar masses (green crosses) in the simulated galaxy as a function of galactic evolution time. Today’s values for the total 26Al content in the Galaxy deduced from the INTEGRAL/SPI observations (2.8 ± 0.8 M⊙, Diehl et al. 2006) are indicated by a (timeoffset) blue box, and estimates for the current star formation rate in the Galaxy (0.35−3.9 M⊙ per year, Table 1 in Elia et al. 2022) are indicated by a (time-offset) red box. Note: the red box continues below the figure. |
| In the text | |
|
Fig. 2 The 26Al distribution in our simulated galaxy. The dots represent disk gas particles at present-day, color-coded to represent the mass of 26Al (in log (gram) unit). The red circle at coordinates [0:0:0] denotes the location of the observer (Solar System) at R ⊙ = 8.5 kpc from the galactic center. The black dashed lines indicate a viewing angle of −40 ≤ ϕ ≤−14, corresponding to the viewing angle highlighted by the black dashed vertical lines in Figure 3. The contour plots represent the LoS velocity to the observer. The outer (inner) black contour represents the ± 100 km/s(± 200 km/s) threshold. The single particles in the external regions with velocities higher than ± 100 km/s originate from an earlier dwarf galaxy disruption event. |
| In the text | |
|
Fig. 3 26Al-longitude-LoS velocity diagram of the same disk gas particles of Figure 2, as seen from the location of the Solar System (i.e., the red circle in Figure 2), color-coded according to their 26Al content (in log (gram) unit). Black dots with error bars show the 26Al detection data by the INTEGRAL/SPI instrument (Kretschmer et al. 2013) and Karsten Kretschmer, personal communication. The dashed vertical lines highlight the region between the viewing angle −40 ≤ ϕ ≤ −14, corresponding to the dashed lines in Figure 2, showing the deviation discussed in the text. |
| In the text | |
|
Fig. 4 Same as Figure 2, but color-coded as function of the number of emitted 1.8 MeV γ-rays per second by each gas particle, as seen by the observer. The outer (inner) black contour representing the 100 km/s (200 km/s) threshold (as in Figure 2) are retained here as a visual guide. |
| In the text | |
|
Fig. 5 Prediction for possible detection of 26Al-decay γ-ray as seen by the future COSI γ-ray detection mission. The x - and y - axis represent the viewing angles of the future instrument. Note: the color-coding here is opposite to that in Figs. 1 and 2 (to achieve a similar color-coding as in Kretschmer et al. 2013), so that higher intensity is represented by darker colors and no detection is represented by the white background. The pixels are Kaiser-interpolated to account for a possible neighbour dependence, as in INTEGRAL/SPI. |
| In the text | |
Current usage metrics show cumulative count of Article Views (full-text article views including HTML views, PDF and ePub downloads, according to the available data) and Abstracts Views on Vision4Press platform.
Data correspond to usage on the plateform after 2015. The current usage metrics is available 48-96 hours after online publication and is updated daily on week days.
Initial download of the metrics may take a while.