Fig. 2
Download original image
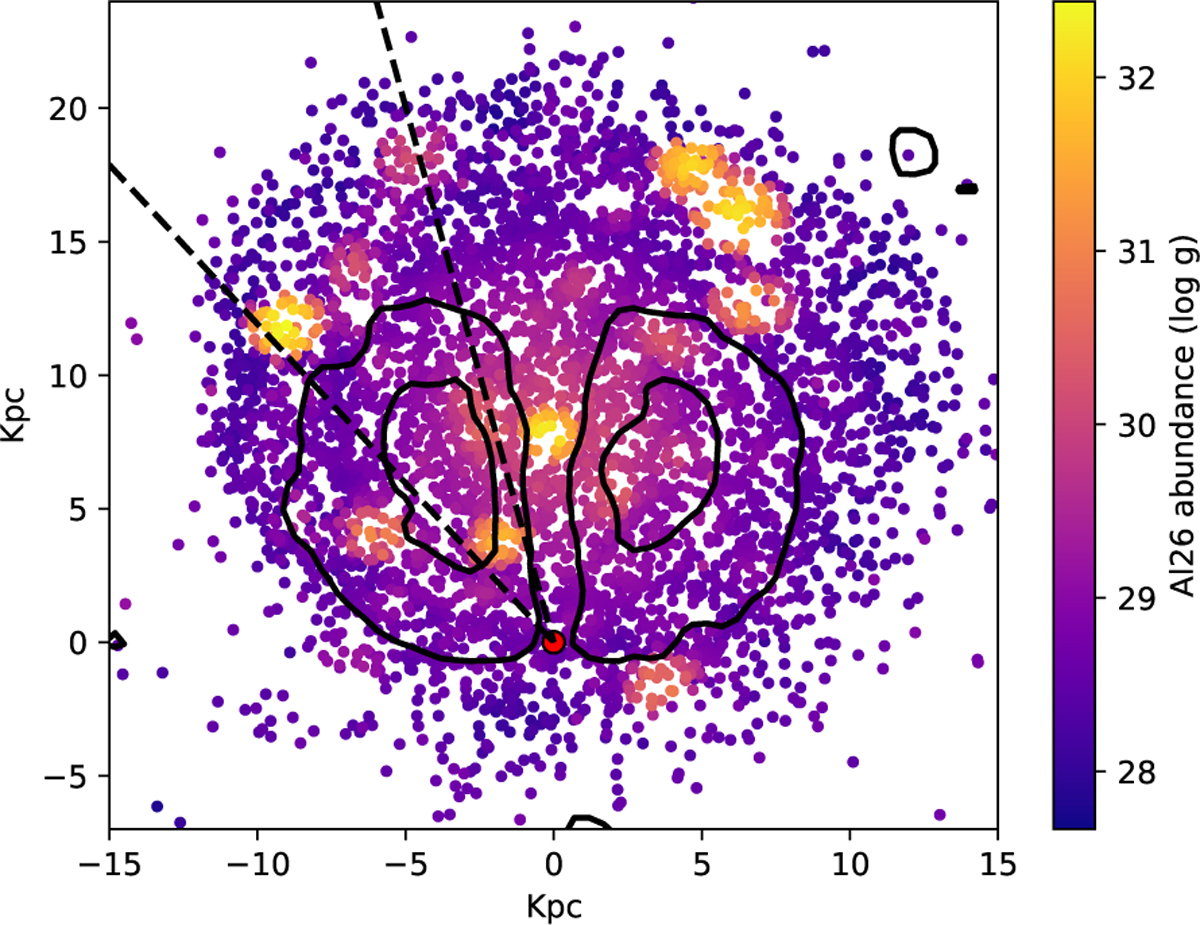
The 26Al distribution in our simulated galaxy. The dots represent disk gas particles at present-day, color-coded to represent the mass of 26Al (in log (gram) unit). The red circle at coordinates [0:0:0] denotes the location of the observer (Solar System) at R ⊙ = 8.5 kpc from the galactic center. The black dashed lines indicate a viewing angle of −40 ≤ ϕ ≤−14, corresponding to the viewing angle highlighted by the black dashed vertical lines in Figure 3. The contour plots represent the LoS velocity to the observer. The outer (inner) black contour represents the ± 100 km/s(± 200 km/s) threshold. The single particles in the external regions with velocities higher than ± 100 km/s originate from an earlier dwarf galaxy disruption event.
Current usage metrics show cumulative count of Article Views (full-text article views including HTML views, PDF and ePub downloads, according to the available data) and Abstracts Views on Vision4Press platform.
Data correspond to usage on the plateform after 2015. The current usage metrics is available 48-96 hours after online publication and is updated daily on week days.
Initial download of the metrics may take a while.