| Issue |
A&A
Volume 672, April 2023
|
|
|---|---|---|
| Article Number | A53 | |
| Number of page(s) | 7 | |
| Section | Interstellar and circumstellar matter | |
| DOI | https://doi.org/10.1051/0004-6361/202245069 | |
| Published online | 30 March 2023 | |
26Al gamma rays from the Galaxy with INTEGRAL/SPI
1
Max-Planck-Institut für extraterrestrische Physik,
Giessenbachstr. 1,
85748
Garching,
Germany
e-mail: This email address is being protected from spambots. You need JavaScript enabled to view it.
2
Horn & Company Financial Services GmbH,
Kaistr. 20,
40221
Düsseldorf,
Germany
3
Institut für Theoretische Physik und Astrophysik, Universität Würzburg,
Emil-Fischer-Str. 31,
97074
Würzburg,
Germany
4
Centre for Astrophysics Research, School of Physics, Astronomy and Mathematics, University of Hertfordshire,
College Lane, Hatfield,
Hertfordshire
AL10 9AB,
UK
Received:
27
September
2022
Accepted:
20
December
2022
Abstract
Context. The presence of radioactive 26Al at 1.8 MeV reveals an ongoing process of nucleosynthesis in the Milky Way. Diffuse emission from its decay can be measured with gamma-ray telescopes in space. The intensity, line shape, and spatial distribution of the 26Al emission allow for studies of these nucleosynthesis sources. The line parameters trace massive-star feedback in the interstellar medium thanks to its 1 My lifetime.
Aims. We aim to expand upon previous studies of the 26Al emission in the Milky Way, using all available gamma-ray data, including single and double events collected with SPI on INTEGRAL from 2003 until 2020.
Methods. We applied improved spectral response and background as evaluated from tracing spectral details over the entire mission. The exposure for the Galactic 26Al emission was enhanced using all event types measured within SPI. We redetermined the intensity of Galactic 26Al emission across the entire sky, through maximum likelihood fits of simulated and model-built sky distributions to SPI spectra for single and for double detector hits.
Results. We found an all-sky flux of (1.84±0.03)×10−3 ph cm−2 s−1 in the 1.809 MeV line from 26Al, determined via fitting to sky distributions from previous observations with COMPTEL. Significant emission from higher latitudes indicates an origin from nearby massive-star groups and superbubbles, which is also supported by a bottom-up population synthesis model. The line centroid is found at (1809.83±0.04 keV), while the line broadening from source kinematics integrated over the sky is (0.62±0.3) keV (FWHM).
Key words: nuclear reactions, nucleosynthesis, abundances / ISM: abundances / stars: massive / supernovae: general / ISM: kinematics and dynamics / gamma rays: ISM
© The Authors 2023
 Open Access article, published by EDP Sciences, under the terms of the Creative Commons Attribution License (https://creativecommons.org/licenses/by/4.0), which permits unrestricted use, distribution, and reproduction in any medium, provided the original work is properly cited.
This article is published in open access under the Subscribe to Open model.
Open Access funding provided by Max Planck Society.
1 Introduction
In our Galaxy,26Al has been established as a tracer of ongoing nucleosynthesis (Prantzos & Diehl 1996). The INTEGRAL mission (Winkler et al. 2003), with its SPI gamma-ray spectrometer (Vedrenne et al. 2003; Roques et al. 2003), has enabled the accumulation of observing time since its 2002 launch (continuing to this day), thanks to measurements the large-scale Galactic 26Al emission. First results (Diehl et al. 2003) have been refined to constrain the extent of the Galaxy's 26Al emission (Wang et al. 2009), so that all-sky imaging could be obtained (Bouchet et al. 2015), which essentially confirms the COMPTEL result. In addition, improvements in background handling led to another step in precision of SPI's 26Al results (Siegert et al. 2016). In this paper, we report the results of our analysis based on nearly 18 yr of data (Pleintinger 2020), using both single and double detector events within the SPI camera for this purpose for the first time, while also exploiting the spectral response and background detail that we obtained from a deep study of the behaviour and variations of SPI spectra over the entire mission.
2 Observations and data analysis approach
2.1 INTEGRAL measurements
The INTEGRAL space observatory was launched by ESA in October 2002 into its excentric orbit located outside the radiation belts (Winkler et al. 2003). The SPI spectrometer (Vedrenne et al. 2003) is one of the two main instruments on INTEGRAL. It performs specialized high-resolution spec-troscopy over the 15 keV-8 MeV energy range with its 19-element Ge detector camera, with an energy resolution of 3 keV at 1809 keV. A coded mask above the camera allows for an imaging process that makes use of detector shadowings by the mask of emission from regions of the sky to achieve an imaging resolution of about 3 degrees. INTEGRAL is pointed at one target direction in the sky for a duration of approximately 30 min, whereafter the pointing direction is normally moved by 2.1° within a rectangular 5 × 5 pattern around the target region of interest. This "dithering" leads to additional variations of the detector shadowing, as the offset angle of 2.1° is matched to the geometrical configuration of detector and mask spacings, corresponding to a one-detector offset of the shadowing for a source on axis. The sensitivity (3σ) of SPI in the 26Al line has been estimated to be about 3 × 10⁻⁵ ph cm−2 s−1 per Ms of exposure (Roques et al. 2003). For individual source regions in the plane of the Galaxy, a sensitivity (3σ) of 2.5 × 10 ph cm−2 s−1 has been achieved at present, as demonstrated for the Vela region with 6 Ms of exposure (Pleintinger 2020).
In this work, we use data from 2002 until 2020, comprising 17.5 yr of observations, covering 2131 INTEGRAL orbits of a typical duration of three days each. The achieved sky exposure is illustrated in Fig. 1, demonstrating that the full sky is covered, although the INTEGRAL mission emphasizes observations of the inner Galaxy. The raw data have been filtered to exclude periods where either spacecraft or the SPI instrument were outside their normal conditions and part of the orbits that might be affected from encounters of the radiation belts near orbit perigee. The selections involving SPI performance include, in particular, acceptance windows on the rates in the BGO anti-coincidence detector system and on saturations in the Ge detectors. After a process of selection, 118 407 spacecraft pointings from 1840 orbits remained, providing a sky exposure of about 255 Ms, with its distribution shown in Fig. 1.
For each of these pointings, the data from single Ge detector hits, as well as those where two Ge detectors triggered within their 350 ns coincidence window (called "double events", DE), were binned into energy spectra for each of the detectors named 00–18; pairs of DE detectors are assigned detector IDs above 18, namely, 19–60. Detectors are numerated from central toward outside in left-spiral counting, so ID = 0 is the central detector and detectors 07–18 are on the outside of the hexagonal dense pack forming the SPI camera. Event data from each detector were calibrated using known background lines, so that the distortions through gain variations are corrected for. Then these events were binned into spectra at 0.5 keV width, covering the 20–2000 keV range for response and background, as well as the 1790–1840 keV range for spectroscopy of the 26Al line. Figure 2 shows the integrated spectra of these basic data, for all single events and all double events combined, respectively. At the 26Al line energy of 1809 keV, the number of double-hit events corresponds to 56% of the amount of single-hit events – all including instrumental background and the celestial 26Al signal.
In total, during the mission, four of the nineteen Ge detectors failed, with detector ID 02/17/05/01 failing in orbit numbers 140/214/775/929, respectively. This means that a different camera response applies after each failure, for different numbers of operational detectors (19-18-17-16-15), changing, in particular, the rates of single versus double or multiple detector triggers (because failed detectors do not provide a "multiple-event" trigger any longer). Figure 3 shows how the ratio of single to multiple detectors undergoes these step-wise changes as detectors have failed over the course of the mission. In this figure, a cumulative value is shown for the time between two annealing operations; these are performed when cosmic-ray bombardment in orbit has degraded the charge collection properties of these semiconductor detectors up to a critical level, that is, roughly every six months, through a two-week heating period (for details see, e.g., Diehl et al. 2018). This change in active detector number requires in total five different instrumental responses and background models, each one designated for the respective camera configurations.
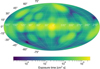 |
Fig. 1 Integrated it INTEGRAL/SPI exposure of the sky of the data used in this paper. Although INTEGRAL’S emphasis of targets is in the inner Galaxy, large parts of the sky have been exposed to at least 10% of the Galactic-disk exposure, allowing for an all-sky analysis. |
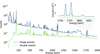 |
Fig. 2 Integrated energy spectrum of counts from the data used in this paper, displaying single events (blue) and double events (green) in the range of 20–2000 keV. Inset enlarges the region around the 26Al line used for astrophysical analysis carried out here. |
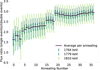 |
Fig. 3 Ratio of counts for single versus multiple events, over the time of the mission for the data used in this paper. Values integrated between successive “detector annealings” are shown: these are performed roughly every six months to recover spectral resolutions after degradation due to cosmic-ray bombardment. Detector failures occurred after 3rd, 4th, 12th, and 15th annealings. Step changes after annealing 15 and 19 reflect a reduction of the detector high voltage (4 to 3 to 2.5 kV) which assists the needs of prolonged operations. |
2.2 Data analysis
Our "data space" is made up of SPI data in the form of a set of detector count spectra for each spacecraft pointing and each detector. Per bin, we have di,j,k measured counts, with i, j, k being the indices of pointing, detector, and energy bin that span the data space. Here, we not only use the spectra from the 19 physical detectors’ events, but also the spectra for double-hit events of adjacent Ge detectors; the respective detector combinations result in additional 42 “virtual” detectors, hence the detector variable j ∈ [0,60] instead of j ∈ [0,18].
These data are the result of the instrument's response to the γ-ray sky and the underlying instrumental background:
 (1)
(1)
Here, we identify sky model components Sn, such as point sources and diffuse emissions. These are formulated in the “image space”, as photon source intensities per sky direction, l. The instrument response matrix, Rl;ijk, must be applied to link the source locations on the sky to data, combining coordinate transformations per pointing to aspect angles, and then accounting for the individual mask or detector configurations of each pointing. This sky signal is superimposed onto a large instrumental background, and we distinguish components, for example, from continuum and from lines reflecting specific processes. The background models are formulated in the same data space of detectors and their counts; no specific instrumental-response application is required, in particular, no shadowing by the mask occurs, as the background is recorded by the active detector volumes from all directions. A comparison of the data as measured to predictions from models is obtained by maximum-likelihood fits of different model sets independently to each energy bin of our data space, thus obtaining the energy spectrum of intensities for the sky model, as a result.
Background is characterized by a continuum that falls off exponentially toward higher energies, as well as about 400 superimposed instrumental lines, reflecting the composition of spacecraft and instrument materials that are target to cosmic-ray interactions (details can be found in Diehl et al. 2018, where background and response are characterized in detail over the entire mission). The method of modeling the instrumental background for the observations actually applied in practice has been described before (Siegert et al. 2019).
Figure 4 shows the performance of our background modeling in the energy region around the 26Al line for single and double events, respectively, also displaying the spectrum of residuals between actual data and the background model (lower graphs). We note that residuals are at the per-mille level in the regime of the 26Al line, and the deviations from Gaussian line shapes (as assumed in our spectral model for the fits) result in residual structures at the percent level across strong background lines. We note that the energy calibration and gain correction procedure as applied at the INTEGRAL Science Data Center, and the degradation from cosmic-ray bombardment with successive annealings, both lead to variations in line shapes that show up as such structured residuals across the regime of each strong background line. Additionally, many of the instrumental lines are blends among several lines with different intensities, as shown for the line near 1764 keV from different Bi isotopes.
The spectral response of SPI Ge detectors is characterized by a high photopeak efficiency and a tail toward lower energies that arises from events where part of the primary photon energy is lost as a secondary photon escapes from the detector. Some of these escaping photons produce double events and thus the full energy is recovered in the photopeak of double events. The flux per energy bin in the photopeak, i, typically exceeds those in the Compton tail by at least one order of magnitude. Therefore, our spectral analysis typically only focuses on the photopeak and adopts a basic Gaussian line shape. In order to account for spectral degradation between annealings, it has been found adequate to supplement this Gaussian by a one-sided exponential distribution extending downward in energy from the photopeak, fitting its width adding τ as a degradation parameter. This spectral model underlies the spectral fits of our instrumental lines (see above and Diehl et al. 2018). The differences in photopeak efficiencies among detectors generates the shadowgram signature for an on-axis direction and is illustrated for the 26Al line energy at 1.8 MeV by the histogram across detectors; we name this the "detector pattern" or "detector ratio", which is shown in Fig. 5 for single and double events, respectively. We normalize to 1.0 if a detector has 1/n of the total intensity, with n the number of active detectors.
The discrimination of signals from the sky versus background occurs in a coded-mask instrument through the coding pattern implied by the mask above the instrument, which results in characteristic relative count distributions among detectors. In first approximation, instrumental background that mostly originates from cosmic-ray activated spacecraft materials should irradiate all detectors similarly; therefore, plausibly the corresponding detector pattern should be nearly flat for background. In detail, deviations and some structure in detector ratios occur, as some of the detectors may be more readily exposed to background from particular components of the spacecraft and instrument than others. For example, Ge background lines should be more intense in centrally located detectors, which are surrounded by Ge everywhere, while Bi background lines should be less intense in central detectors, as outer detectors are exposed to the BGO detectors directly. The latter is illustrated in Fig. 6, which shows the detector pattern for the background line near 1764 keV, which originates from different Bi isotopes as activated from cosmic rays. The upper graph shows results from single events and the lower shows results from double events, for the first epoch of data where all 19 detectors still were operational. In fine scale along each detector ID, we superimpose the detector ratios for the different orbits within this epoch to illustrate variations across Sorter time scale. Evidently, me detector pattern remains rather stable, wimin few percent Each line, as well as the continuum has its own characteristic detector pattern, which we applied in our background model, after it has been derived from the intensity of each Gaussian line fitted to each detector’s spectra.
The detector pattern for background remains identical over time, within a few percent (Diehl et al. 2018), while the detector pattern for celestial gamma rays ("shadowgram") varies as spacecraft pointings are offset by 2° on the 1/2 hour time scale. We thus obtained a sensitise discrimination of emission from the sky versus instrumental background. In the maximum-likelihood fit, we further allowed for adjustments of the absolute scale of the background with time, accounting for the fact that our primary data for background model determination already unavoidably include the emission from the sky. While this is a local signature, thus diluted to a small renormalization effect within statistical noise for weaker point sources, the diffuse all-sky emission from 26Al may produce detector patterns that are only weakly modulated and closer to those of background; thus, these temporal adjustments of the relative detector ratios in the background model improves its fit and helps to discriminate a weakly modulated sky contribution. We additionally benefit from our assumption that the 26Al emission may vary with direction, but not in time.
Our fit maximizes the likelihood of model-predicted data in view of our measured data using Poissonian statistics and optimizes model parameters θ therein to extract a spectrum of sky model coefficients θn (S), as described above. In order to obtain a measure for the relative quality of such a fit, we derive a test statistic Φ that compares the log-likelihood difference between each model, M1, and the baseline hypothesis of fitting data, D, with just the background model alone (hypothesis M0):

This allows us to carry out a comparison and ranking of the performance for different models, with higher values implying a better fit and the low-end reference being the likelihood of the measured data if assuming background alone. It is important to check how the spectral result obtained from above analysis approach depends on the assumed morphology of 26Al emission across the sky. For this purpose, we typically repeat our spectral fitting for a range of plausible emission morphologies, generated independently, revised or from data that are unrelated to our analysis dataset itself. In an earlier paper (Wang et al. 2009), a detailed comparison of 26Al line parameters for a set of plausible emission morphologies was discussed. In particular, Fig. 6 demonstrates that the centroid and width of the 26Al line are practically independent of morphology for a wide range of plausible but different morphologies, while the line flux shows some variation among models. We concluded that the sensitivity of our spectral results to image morphology is reduced to the total flux measured and the line amplitude reflects how the sky model component matches SPI data in detail better than the background model alone. Therefore, we now focus on an evaluation of line fluxes and on how well different morphology models fit our dataset, after these have been convolved into our dataspace using the instrument response from coded masking and dithering.
Once we obtained a spectrum of sky model coefficients, as drawn from the likelihood optimization of our fit, we extracted the spectral parameters through a Bayesian forward-folding approach as follows. We describe the spectrum through a Gaussian line with flux, F, centroid, E0, and width, σ, plus a continuum approximated by a power-law function, cE−α. After choosing appropriate priors for the uncertainty of each of these parameters, we then applied a Markov chain Monte Carlo (MCMC) fit to the extracted spectrum, forward-folding this spectral model through the spectral response of SPI. This MCMC analysis samples the posterior distribution for each parameter of the fit from given data and priors, maximizing the full posterior distribution to determine best-fit parameter values. Our priors were hased on the detailed spectral response analysis from the data of the enfire miss-on and energy range (Diehl et al. 2018). The spectral response describes how incident photons are distributed among measured energies; it is dominated by the photopeak with inSrumental line width, ESPI, and also includes the degradation parameter τ, as described above. Moreover, note that the Gaussian line width includes two components, which we aim to separate for the purpose of astrophysical interpretation: the instrumental line width FWHMSPI adds in quadrature to an astrophysical line broadening from the Doppler effect of 26Al nuclei as they move in interstellar space while decaying, namely, FWHMsky. The posterior probability distributions for these seven parameters that describe our spectral result are shown below, as is the probability distribution of the photon model itself (green area in spectra shows the 95% confidence region of the model).
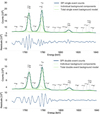 |
Fig. 4 Energy spectrum of the background model used for the single events (above) and double events (below). |
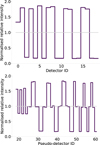 |
Fig. 5 Detector signature (ratio) of a celestial source viewed on axis, for single and multiple events, respectively. |
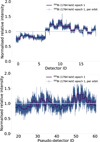 |
Fig. 6 Detector signature (ratio) of the background in the 1764 keV line, for single andmultiple events, respectively (see text for details). |
2.3 Models for the spatial distribution of the emission
For our baseline analysis, we used the image obtained from the COMPTEL 9-yr allsky survey, as it had been produced through maximum entropy deconvolution (Diehl et al. 1995; Plüschke et al. 2001). This map is thought to best represent our knowledge of 26Al emission from the Galaxy based on observations (see Prantzos & Diehl 1996; Diehl 1995; Knödlseder et al. 1999b, for a discussion). We could use the image obtained for INTEGRAL/SPI with a likelihood analysis (Bouchet et al. 2015), which was obtained with background modeling from a general detector pattern and including a single normalization parameter for each pointing as well as free parameters of many pixels on the sky. Using this result would imply using partially overlapping data, and so we did not pursue this here.
Alternatively, we could employ models taken from astro-physical considerations of the spatial distribution of 26Al sources in our Galaxy or from tracers that plausibly may represent these (e.g., Diehl et al. 1997; Knödlseder et al. 1999a). This has already been pursued in detail in the context of a comparison between 26Al and 60Fe models (see Wang et al. 2020), thus it is not repeated here.
As another alternative pursued more recently, we constructed a bottom-up model for a galaxy, starting from models of stars with their evolution and nucleosynthesis yields, building stellar groups using a mass spectrum, and, finally, placing these groups into a spatial model for the galaxy. Drawing up random realizations of such a model by sampling the parameters included in such a bottom-up stars-groups-galaxy model, we are able to obtain a stellar population synthesis-based model of a galaxy. We used the PSYCO implementation of such an approach (see details in Pleintinger 2020; Siegert et al. 2023). This provides us with a predictive model for the appearance of the observed 26Al sky, evaluating the Galaxy's content of 26Al from theory inputs concerning source evolution and nucleosynthesis output, allowing us to compare the observed flux to expectations from theory.
3 Results
Using 17.5 yr of data and the COMPTEL-derived sky distribution of 26Al emission, we derived spectra around the 26Al line at 1808.65 keV (shown in Fig. 7) for single and for double events, separately, as well as in combination. The spectral parameter values and their uncertainties (confidence regions) were derived from an MCMC analysis, as shown in Figs. 8 and 9, illustrating the uncertainties of the fit. Fitting background models separately per event type, but with a single set of line characteristics, a total detection significance of 58σ is found for the 26Al line. Single-hit events only show a significance of 51σ, and double-hit events alone provide a clear 27σ detection above background. Table 1 provides fit results for single and double-hit events, as well as for data combining both event types. Intensity, line centroid, and line width are consistent within uncertainties between single-hit, double hit, and combined-event results. We note that the "total" result was derived through a separate analysis chain (see Sect. 2.2), rather than averaging single and double event results.
We find that the spectral response appears to be less sharp for double events, as spectral resolution of SPI for single events is 3.17 keV at 1.8 MeV (Diehl et al. 2018). This is attributed to a bias in locations of events within Ge detectors, with double events favored among events detected from interactions in outer regions, rather than closer to the central anode. Charge collection properties vary across the detector with radius from the anode and a bias in location will plausibly produce a line shape deviating from the all-detector sample in single events (confirmed to be nearly Gaussian after annealings).
Decomposing the line width into contribution s from instrumental resolution as measured with other instrumental lines versus line broadening of the celestial contribution, we obtained a consistent celestial broadening of (0.46±0.3) keV and (0.76±0.6) keV, respectively, for single and double events. This leads to a combined result of (0.62±0.03) keV, which again is dominated by the single-events contribution.
The line centroid is found at (1809.83±0.04) keV from the combined data. The laboratory value is 1808.65(7) keV and, thus, the integrated 26Al emission from the Galaxy appears blue-shifted by about 1.2 keV. The all-sky flux for the 26Al line is determined as (1.84±0.03)×10−3 ph cm−2 s−1.
Our baseline model for the emission morphology, taken from the COMPTEL 26Al results, obtains a test statistic value of 2160. We cannot use the emission morphology derived from SPI for a scientific result as it uses partially overlapping data; but still this provides an interesting reference for our test statistic, obtaining Φ = 2166 for such a self-consistent image morphology. By comparison, our best-fitting bottom-up population synthesis model PSYCO obtains a test statistic value Φ = 2061, while other PSYCO variants discussed in detail in companion paper (Siegert et al. 2023) obtain Φ values between 1500 and 2061.
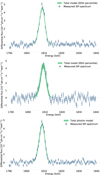 |
Fig. 7 Energy spectrum around the 26Al line, as obtained from single-hit events (top), double-hit events (middle), and combined events (bottom) of our observations. Data points represent the measurement, with bin width and Poissonian statistical uncertainty indicated. The uncertainties shown in shaded green have been derived from MCMC modeling of the spectral response, and show variations within 95% of the model. |
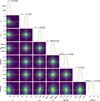 |
Fig. 8 Posterior distributions of spectral parameters around the 26Al line of the total-events spectrum, Fig. 7 (bottom), illustrating confidence regions for each parameter. |
Fitted spectral line parameters. Intensity is given in units ![Mathematical equation: $\left[ {{{10}^{ - 3}}{{{\rm{ph}}} \over {{\rm{c}}{{\rm{m}}^2}{\rm{s}}}}} \right]$](/articles/aa/full_html/2023/04/aa45069-22/aa45069-22-eq3.png) , while centroid and width (FWHM) are in keV units.
, while centroid and width (FWHM) are in keV units.
4 Discussion
Our dataset comprises single-hit and double-hit events; at the 26Al line energy of 1809 keV, the number of double-hit events corresponds to 56% of the amount of single-hit events, all including instrumental background and the celestial 26Al signal. Applying our analysis of fitting models of instrumental background and sky and including spectral response details, this results in an increase of the signal from celestial 26Al through the additional use of double-hit events that would be equivalent to an additional observing time of 30%.
The main characteristics of 26Al emission from the Galaxy, as found from earlier works, are confirmed by our analysis, including also double-hit detector events. The line centroid at (1809.83±0.04) keV implies a blue shift corresponding to Doppler velocities of order 100 km s−1. We attribute this to our aspect of emission regions throughout the Galaxy, which (due to large-scale Galactic rotation) are moving at such typical velocities with respect to the local standard of rest (see Kretschmer et al. 2013, for longitude-resolved analysis). Line broadening from source kinematics integrated over the sky is found to be (0.62±0.3) keV (FWHM). This is consistent with the Doppler broadening from regions at different bulk velocities to the observer, as incurred from large-scale Galactic rotation and the dispersal of 26Al into superbubbles, as found before (Kretschmer et al. 2013), with implications discussed, for instance, in Krause et al. (2015).
We find an all-sky flux of (1.84±0.03)×l0−3 ph cm−2 s−1 for the 26Al line from our analysis of 18.5 yr of data and using single as well as double events. We note that uncertainties are thereby at the level of 2% (see Fig. 8).
The flux attributed to the "inner Galaxy" is ~3×10⁻⁴ ph cm−2 s−1, or 16% of the total flux. The inner Galaxy has often been used for comparisons and may be defined as a longitude range ±30 degrees around the Galactic centre, or (slightly differently) the "inner radian" (57 degrees). This region often had been analysed as a reference toward obtaining results representative for the Galaxy as a whole, thus focusing on the brightest region and avoiding issues from low surface-brightness contributions that often are subject to systematic uncertainties from background determinations. Different latitude ranges have been used as well, from ±5 to 15 degrees. We note that the majority of the integrated flux is found outside the inner Galaxy, as reported earlier (see Pleintinger et al. 2019, and Table 1 therein). This is in tension with simulations and expectations, which typically report 50% of the all-sky flux coming from the inner Galaxy. Special nearby regions, such as Cygnus, Scorpius-Centaurus, and Orion, have been known before to potentially lead to distortions of such Galaxy-wide conclusions. It remains a challenge to properly account for flux contributions from nearby regions in particular, as the imaging performance of the coded mask degrades for diffuse emission that extends over large parts of the entire sky.
An earlier analysis (Wang et al. 2020) found an all-sky 26Al flux of (1.68±0.07)×10−3 ph cm−2 s−1. These authors used geometrical models only, for the spatial distribution of the emission and this flux was derived for a best-matching double-exponential disk size with scale parameters radius = 7 kpc and height = 800 pc. Another earlier analysis, using 13.5 yr of data (Pleintinger et al. 2019), found an all-sky flux of (1.71±0.06)×10−3 ph cm−2 s−1 from using single-event hits only. Here, the COMPTEL map had been used as a model for spatial distribution. Using different spatial models for 26Al emission morphology, flux results typically vary within ≤10% (see, e.g. Diehl et al. 2010). These cases illustrate that the overall flux of the sky in 26Al γ rays is rather well constrained, and our flux determined from using single and double events agrees with these results within the uncertainties.
We note that our bottom-up population synthesis model PSYCO predicts a substantially lower flux value (see Siegert et al. 2023, for details and discussion). Recently, from the COSI balloon flight of 2016, a flux measurement in the 26Al line was published (Beechert et al. 2022), which is somewhat higher (2σ) than our measurement: these authors find (8.6±2.5)×10−4 ph cm−2 s−1 from for the "inner Galaxy", compared to ~3×10⁻⁴ ph cm−2 s−1 from our PSYCO map-based analysis. These authors also discuss potential calibration issues for COSI absolute efficiency. Nevertheless, it is important to perform measurements with instruments that carry a variety of systematics, such as different fields of view and imaging methods.
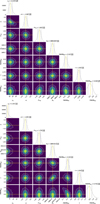 |
Fig. 9 Posterior distributions of spectral parameters around the 26Al line for the spectra derived separately for single (top) and double events (bottom). |
5 Summary and conclusions
Using INTEGRAL SPI events of single- and double-hit types, we enhanced the detection efficiency for Galactic 26Al emission. We applied improved spectral response and background, as evaluated from tracing all-event spectral details over the entire mission and redetermined the intensity of Galactic 26Al emission across the entire sky. Herein, we applied maximum likelihood fits of simulated and model-built sky distributions to measurements of single and double events in INTEGRAL's SPI detectors. The spectral results are consistent with previous measurements, within the uncertainties. A shift in the line centroid with respect to the laboratory value reflects an integrated blueshift attributed to large-scale Galactic rotation and aspect of regions, with their respective relative velocities to the Solar System. Line broadening confirms the Doppler broadening from regions at different bulk velocities to the observer, as incurred from large-scale Galactic rotation and the dispersal of 26Al into superbubbles (Kretschmer et al. 2013; Krause et al. 2015). We find an all-sky flux of (1.84±0.03)×10−3 ph cm−1 s−1 that appears somewhat larger than upscaling from values for the inner Galaxy (Wang et al. 2009; Prantzos 1996). This indicates that 26Al emission also extends to regions beyond the Galactic plane and toward higher latitudes. Such emission is attributed to nearby superbubbles, that are related to the nearby Scorpius-Centaurus groups of massive stars (Krause et al. 2018), the local bubble (Zucker et al. 2022), and chimneys that connect large superbubbles with the Galactic halo (Pleintinger et al. 2019; Krause et al. 2021). Large-scale Galactic 26Al emission has been used to infer, for instance, the total 26Al mass in our Galaxy and the supernova rate (e.g., Diehl et al. 2006), based on inner-Galaxy flux values. Although their conclusions largely remain identical, these are subject to small adjustments from improved precision of 26Al flux values in regions that aptly characterize our Galaxy at large.
Acknowledgments
This study was supported by the Deutsche Forschungsgemeinschaft (DFG, German Research Foundation) under its Excellence Strategy, the Munich Clusters of Excellence "Origin and Structure of the Universe" and "Origins" (EXC-2094-390783311), and by the EU through COST action ChETEC CA160117. The INTEGRAL/SPI project has been completed under the responsibility and leadership of CNES; we are grateful to ASI, CEA, CNES, DLR, ESA, INTA, NASA and OSTC for support of this ESA space science mission.
References
- Beechert, J., Siegert, T., Tomsick, J. A., et al. 2022, ApJ, 928, 119 [NASA ADS] [CrossRef] [Google Scholar]
- Bouchet, L., Jourdain, E., & Roques, J.-P. 2015, ApJ, 801, 142 [NASA ADS] [CrossRef] [Google Scholar]
- Diehl, R. 1995, Exp. Astron., 6, 103 [NASA ADS] [CrossRef] [Google Scholar]
- Diehl, R., Dupraz, C., Bennett, K., et al. 1995, A&A, 298, 445 [NASA ADS] [Google Scholar]
- Diehl, R., Oberlack, U., Knödlseder, J., et al. 1997, AIP Conf. Ser., 410, 1114 [NASA ADS] [CrossRef] [Google Scholar]
- Diehl, R., Kretschmer, K., Plüschke, S., et al. 2003, Astron. Nachr. Suppl., 324, 18 [NASA ADS] [Google Scholar]
- Diehl, R., Halloin, H., Kretschmer, K., et al. 2006, Nature, 439, 45 [CrossRef] [PubMed] [Google Scholar]
- Diehl, R., Lang, M. G., Martin, P., et al. 2010, A&A, 522, A51 [NASA ADS] [CrossRef] [EDP Sciences] [Google Scholar]
- Diehl, R., Siegert, T., Greiner, J., et al. 2018, A&A, 611, A12 [NASA ADS] [CrossRef] [EDP Sciences] [Google Scholar]
- Knödlseder, J., Bennett, K., Bloemen, H., et al. 1999a, A&A, 344, 68 [NASA ADS] [Google Scholar]
- Knödlseder, J., Dixon, D., Bennett, K., et al. 1999b, A&A, 345, 813 [NASA ADS] [Google Scholar]
- Krause, M. G. H., Diehl, R., Bagetakos, Y., et al. 2015, A&A, 578, A113 [NASA ADS] [CrossRef] [EDP Sciences] [Google Scholar]
- Krause, M. G. H., Burkert, A., Diehl, R., et al. 2018, A&A, 619, A120 [NASA ADS] [CrossRef] [EDP Sciences] [Google Scholar]
- Krause, M. G. H., Rodgers-Lee, D., Dale, J. E., Diehl, R., & Kobayashi, C. 2021, MNRAS, 501, 210 [Google Scholar]
- Kretschmer, K., Diehl, R., Krause, M., et al. 2013, A&A, 559, A99 [NASA ADS] [CrossRef] [EDP Sciences] [Google Scholar]
- Pleintinger, M. M. M. 2020, Ph.D. Thesis, Technische Universität München, Germany [Google Scholar]
- Pleintinger, M. M. M., Siegert, T., Diehl, R., et al. 2019, A&A, 632, A73 [NASA ADS] [CrossRef] [EDP Sciences] [Google Scholar]
- Plüschke, S., Diehl, R., Schönfelder, V., et al. 2001, ESA SP, 459, 55 [Google Scholar]
- Prantzos, N. 1996, A&AS, 120, 303 [NASA ADS] [Google Scholar]
- Prantzos, N., & Diehl, R. 1996, Phys. Rep., 267, 1 [NASA ADS] [CrossRef] [Google Scholar]
- Roques, J. P., Schanne, S., von Kienlin, A., et al. 2003, A&A, 411, L91 [NASA ADS] [CrossRef] [EDP Sciences] [Google Scholar]
- Siegert, T., Diehl, R., Khachatryan, G., et al. 2016, A&A, 586, A84 [NASA ADS] [CrossRef] [EDP Sciences] [Google Scholar]
- Siegert, T., Diehl, R., Weinberger, C., et al. 2019, A&A, 626, A73 [NASA ADS] [CrossRef] [EDP Sciences] [Google Scholar]
- Siegert, T., Pleintinger, M., Diehl, R., et al. 2023, A&A, 672, A54 [NASA ADS] [CrossRef] [EDP Sciences] [Google Scholar]
- Vedrenne, G., Roques, J.-P., Schönfelder, V., et al. 2003, A&A, 411, L63 [CrossRef] [EDP Sciences] [Google Scholar]
- Wang, W., Lang, M. G., Diehl, R., et al. 2009, A&A, 496, 713 [NASA ADS] [CrossRef] [EDP Sciences] [Google Scholar]
- Wang, W., Siegert, T., Dai, Z. G., et al. 2020, ApJ, 889, 169 [NASA ADS] [CrossRef] [Google Scholar]
- Winkler, C., Courvoisier, T. J.-L., Di Cocco, G., et al. 2003, A&A, 411, L1 [NASA ADS] [CrossRef] [EDP Sciences] [Google Scholar]
- Zucker, C., Goodman, A. A., Alves, J., et al. 2022, Nature, 601, 334 [NASA ADS] [CrossRef] [Google Scholar]
All Tables
Fitted spectral line parameters. Intensity is given in units , while centroid and width (FWHM) are in keV units.
All Figures
|
Fig. 1 Integrated it INTEGRAL/SPI exposure of the sky of the data used in this paper. Although INTEGRAL’S emphasis of targets is in the inner Galaxy, large parts of the sky have been exposed to at least 10% of the Galactic-disk exposure, allowing for an all-sky analysis. |
| In the text | |
|
Fig. 2 Integrated energy spectrum of counts from the data used in this paper, displaying single events (blue) and double events (green) in the range of 20–2000 keV. Inset enlarges the region around the 26Al line used for astrophysical analysis carried out here. |
| In the text | |
|
Fig. 3 Ratio of counts for single versus multiple events, over the time of the mission for the data used in this paper. Values integrated between successive “detector annealings” are shown: these are performed roughly every six months to recover spectral resolutions after degradation due to cosmic-ray bombardment. Detector failures occurred after 3rd, 4th, 12th, and 15th annealings. Step changes after annealing 15 and 19 reflect a reduction of the detector high voltage (4 to 3 to 2.5 kV) which assists the needs of prolonged operations. |
| In the text | |
|
Fig. 4 Energy spectrum of the background model used for the single events (above) and double events (below). |
| In the text | |
|
Fig. 5 Detector signature (ratio) of a celestial source viewed on axis, for single and multiple events, respectively. |
| In the text | |
|
Fig. 6 Detector signature (ratio) of the background in the 1764 keV line, for single andmultiple events, respectively (see text for details). |
| In the text | |
|
Fig. 7 Energy spectrum around the 26Al line, as obtained from single-hit events (top), double-hit events (middle), and combined events (bottom) of our observations. Data points represent the measurement, with bin width and Poissonian statistical uncertainty indicated. The uncertainties shown in shaded green have been derived from MCMC modeling of the spectral response, and show variations within 95% of the model. |
| In the text | |
|
Fig. 8 Posterior distributions of spectral parameters around the 26Al line of the total-events spectrum, Fig. 7 (bottom), illustrating confidence regions for each parameter. |
| In the text | |
|
Fig. 9 Posterior distributions of spectral parameters around the 26Al line for the spectra derived separately for single (top) and double events (bottom). |
| In the text | |
Current usage metrics show cumulative count of Article Views (full-text article views including HTML views, PDF and ePub downloads, according to the available data) and Abstracts Views on Vision4Press platform.
Data correspond to usage on the plateform after 2015. The current usage metrics is available 48-96 hours after online publication and is updated daily on week days.
Initial download of the metrics may take a while.