Fig. 7
Download original image
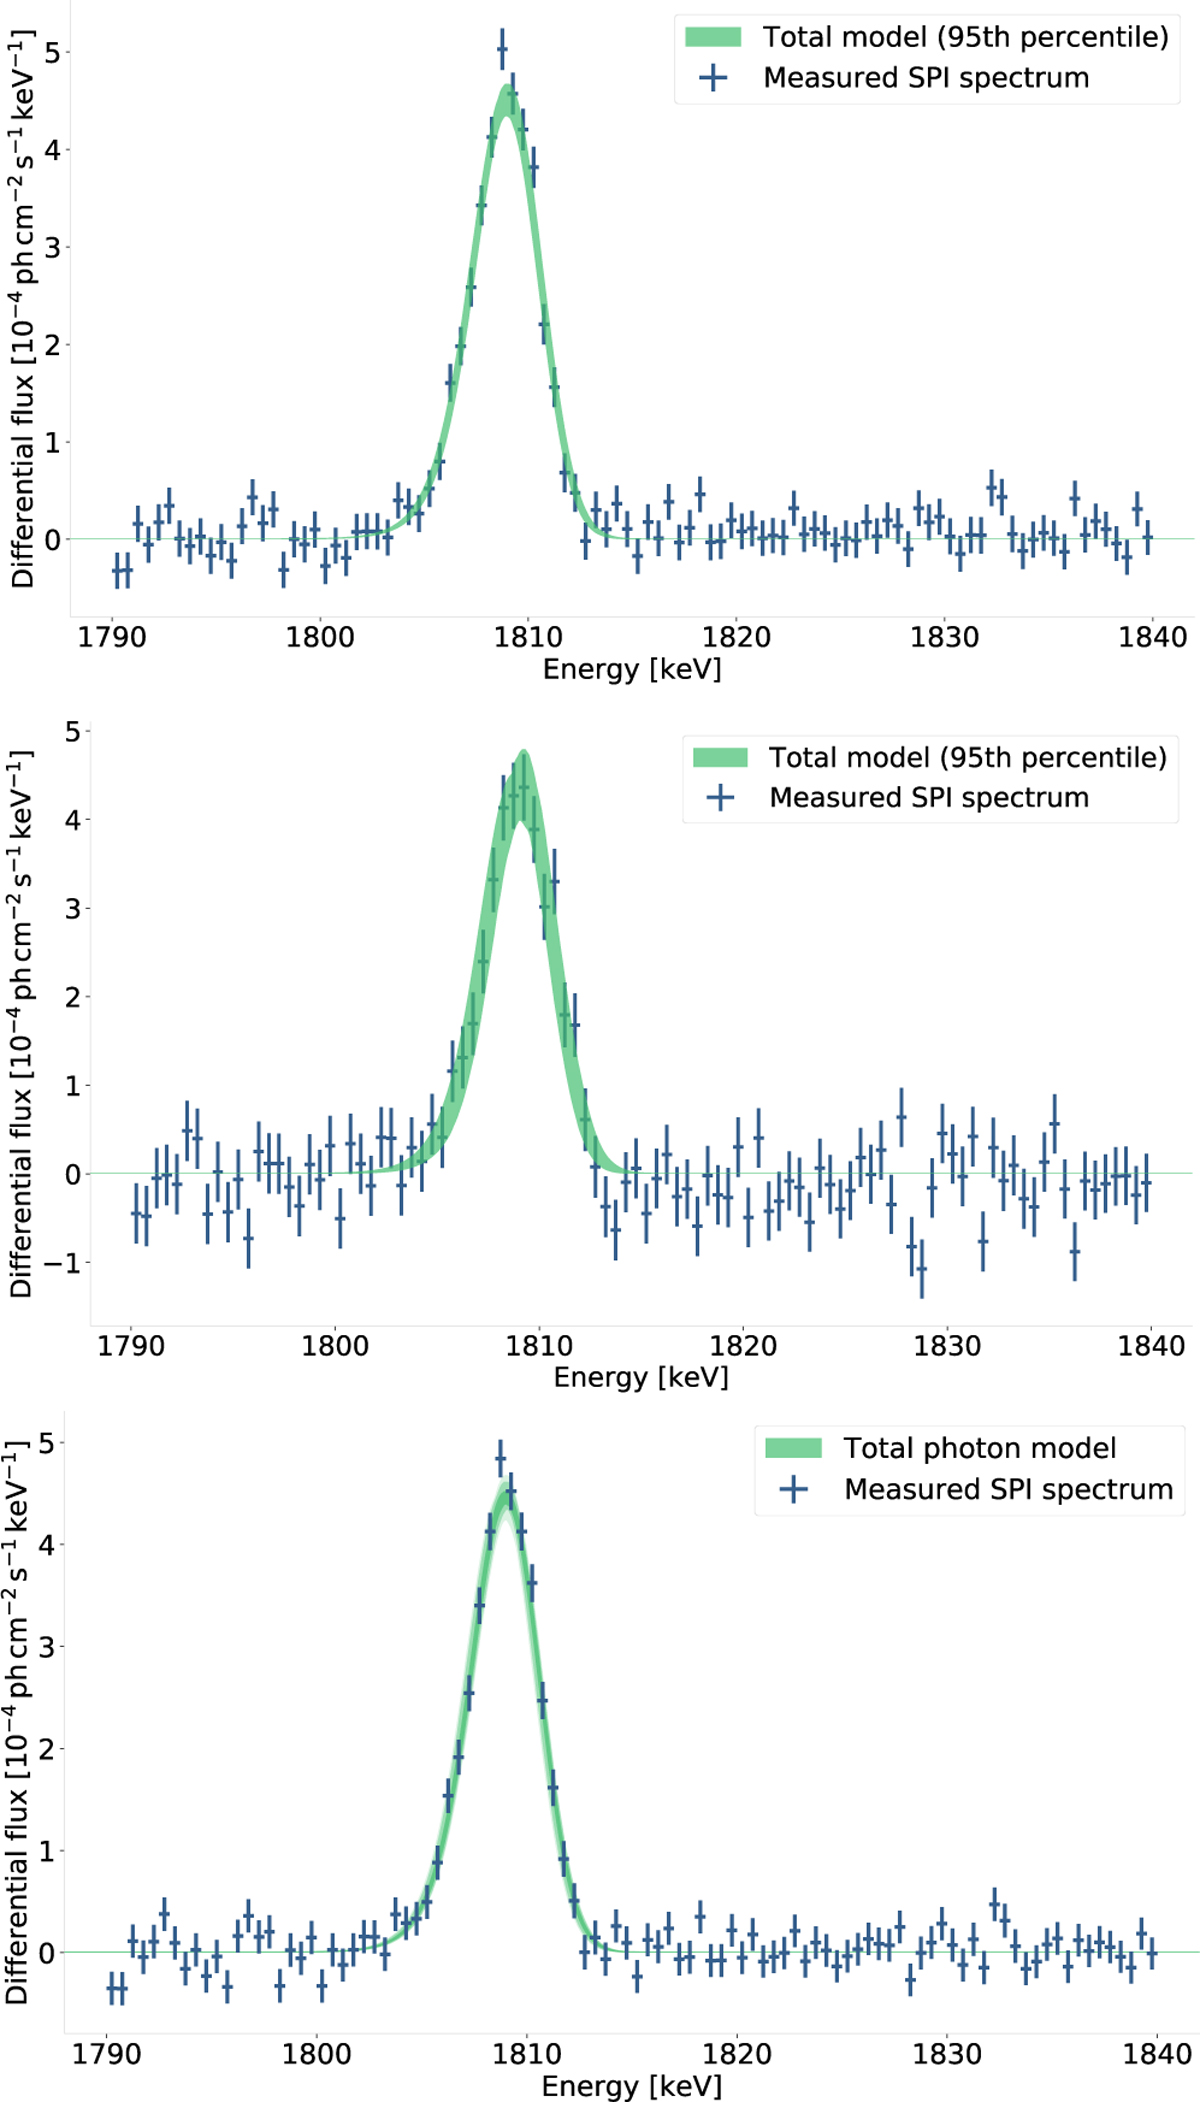
Energy spectrum around the 26Al line, as obtained from single-hit events (top), double-hit events (middle), and combined events (bottom) of our observations. Data points represent the measurement, with bin width and Poissonian statistical uncertainty indicated. The uncertainties shown in shaded green have been derived from MCMC modeling of the spectral response, and show variations within 95% of the model.
Current usage metrics show cumulative count of Article Views (full-text article views including HTML views, PDF and ePub downloads, according to the available data) and Abstracts Views on Vision4Press platform.
Data correspond to usage on the plateform after 2015. The current usage metrics is available 48-96 hours after online publication and is updated daily on week days.
Initial download of the metrics may take a while.